


0
Currency & Commodity Analysis:
US Dollar Index
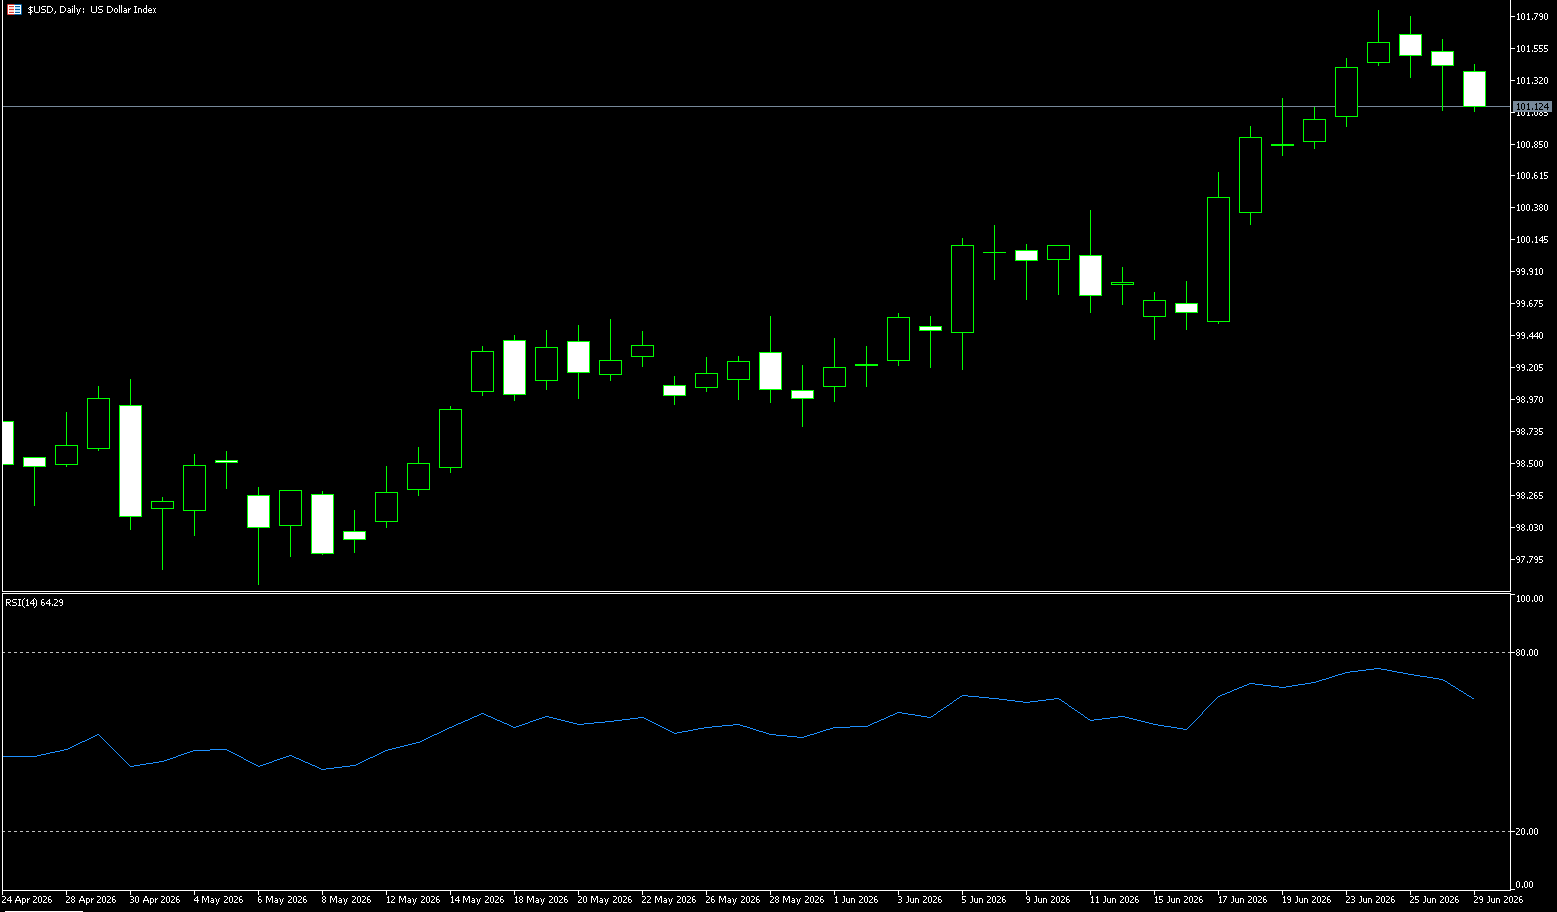
The US dollar fell for the second consecutive week as key US inflation data met expectations and lower oil prices slightly cooled market expectations for a Fed rate hike. However, the US dollar index still rose last week, posting its largest monthly gain since July last year. The US dollar index climbed steadily at the beginning of last week, reaching a 13-month high. Although it later saw a slight pullback due to economic data, it still recorded its second consecutive weekly gain and is on track for its largest monthly increase since July of last year. This trend not only reflects the market's strong expectations of a hawkish stance from the new Federal Reserve Chairman, Warsh, but also incorporates multiple factors such as stock market volatility and geopolitical uncertainty, providing solid support for the dollar. Meanwhile, this round of dollar strength overturns the trading logic of several months ago. Previously, the market generally believed that geopolitical conflicts in the Middle East pushing up oil prices would raise inflation expectations, thus benefiting the dollar, forming a "high oil price, strong dollar" logic. However, since mid-May, international oil prices have fallen by about 30%, while the dollar index has risen instead, creating a clear divergence of "falling oil prices, rising dollar."
Overall, the current strength of the dollar is based on the market's firm expectation of a Federal Reserve interest rate hike this year. This week's non-farm payroll data will be a crucial test of this expectation—strong data will further solidify expectations of an interest rate hike, and the dollar is likely to reach new highs; weak data may trigger a phase of correction in the dollar and open the door for yen intervention. In any case, a storm is brewing. The RSI indicator has risen to 70, approaching the 80 overbought threshold, indicating a short-term need for technical correction, but this does not damage the medium- to long-term upward trend. If the dollar index rises above 101.80 (last week's high) and 102.00 (a psychological level), the next target will be 102.69 (the low of September 2024), and a break above that would point to 103 (a psychological level). Only a decisive break below 101.00 (a psychological level) and the 101.08 (9-day simple moving average) area will allow the dollar index to potentially reverse its short-term bullish trend and move towards the key psychological level of 100.00.
Today, consider shorting the US Dollar Index at 101.20, with a stop-loss at 101.30 and targets of 100.80 and 100.70.
WTI Crude Oil
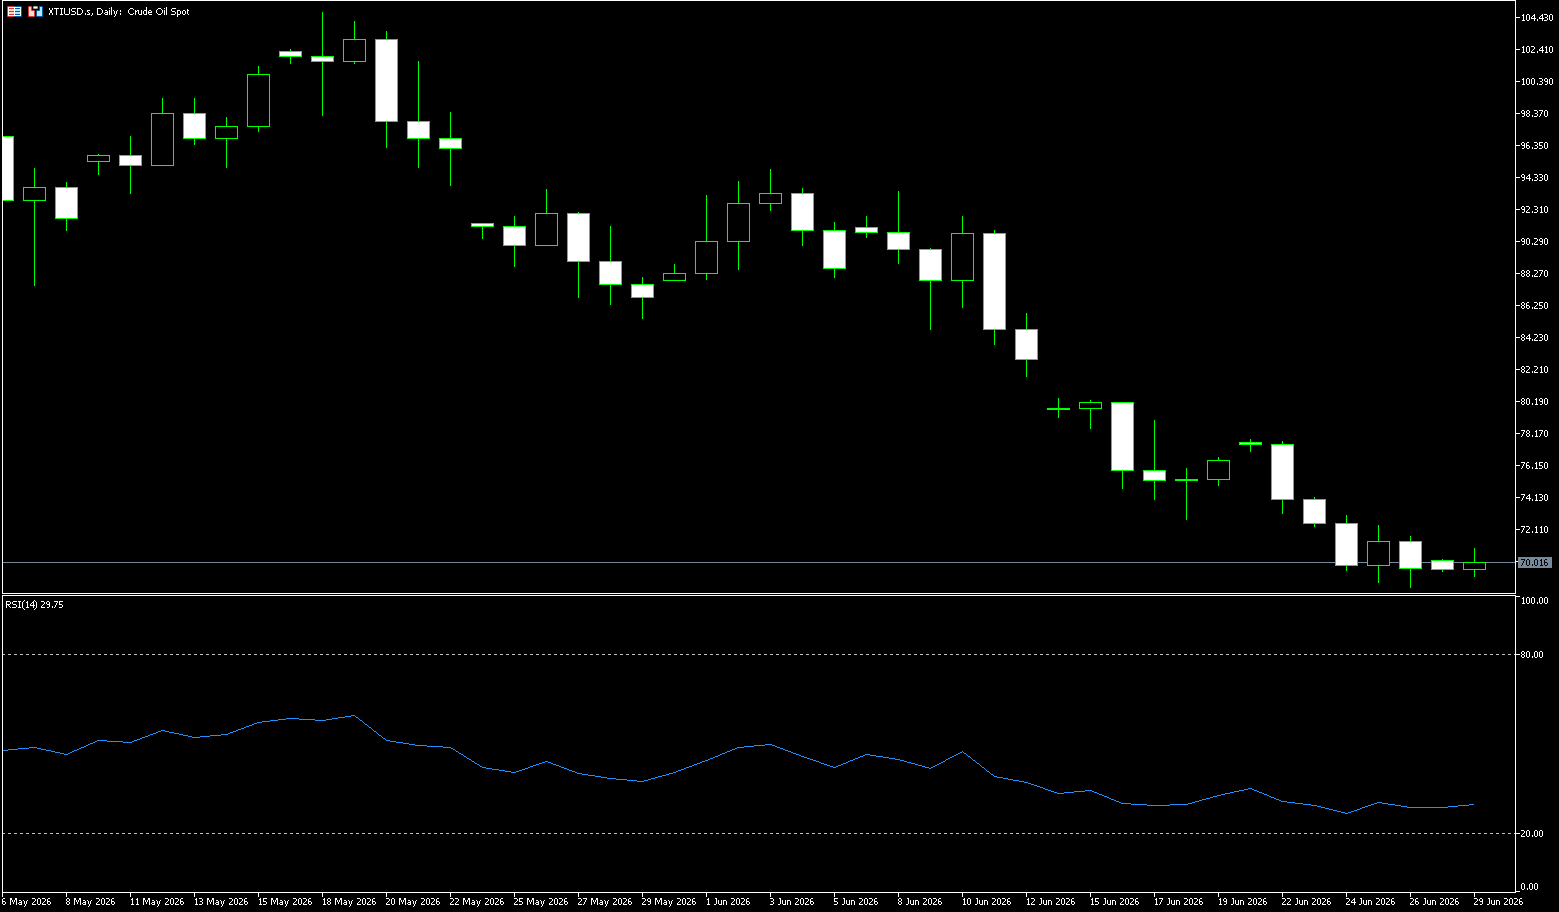
US crude oil traded around $70/barrel at the beginning of the week. Over the weekend, the US military again attacked Iranian targets, and Iran stated that it would have full control of the Strait of Hormuz for the next 30 days, delaying intervention and increasing uncertainty. Meanwhile, it is reported that the US and Iran will meet in Doha on Tuesday. Last week, the international crude oil market experienced a dramatic rollercoaster ride. Against the backdrop of signals of easing supply risks from the high-level US-Iran talks, oil prices fell sharply for several consecutive days, hitting lows since the outbreak of the war. However, with the attack on a cargo ship near Oman and subsequent US airstrikes on Iran and the Iranian Revolutionary Guard's retaliation, geopolitical tensions briefly rose, driving a technical rebound in oil prices. Overall, however, the gradual resumption of shipping activity in the Strait of Hormuz and the release of stranded crude oil became the core forces driving market trends, ultimately resulting in a significant weekly decline in oil prices.
From a market performance perspective, geopolitical risks have once again become a major driver of current crude oil prices. Against the backdrop of increased supply-side uncertainty, investors are paying closer attention to the future navigation situation in the Strait of Hormuz, whether exports from major oil-producing countries will be affected, and whether diplomatic negotiations between the US and Iran can continue. Looking at the daily chart, WTI crude oil has rebounded for two consecutive trading days, with prices regaining their position above short-term moving averages, indicating a recovery in market buying power. However, it remains within its recent trading range, with bulls and bears still vying for direction. Short-term support has gradually formed around $71.00. If it can effectively break through and hold above the 200-day moving average of $73.08, oil prices are expected to further challenge the $73.50 to $74.00 area. If it falls below $70.00 (a psychological level), it may retest $68.80 (last week's low, a support level for any rebound), and a break below that would indicate a return to weakness. The core medium-term support is $67.00 (the previous gap fill level; a key monthly support); while the deep support is $65 (the medium-term downside target).
Today, consider going long on crude oil at $70.15, with a stop-loss at $70.00 and targets at $72.50 and $72.00.
Spot Gold
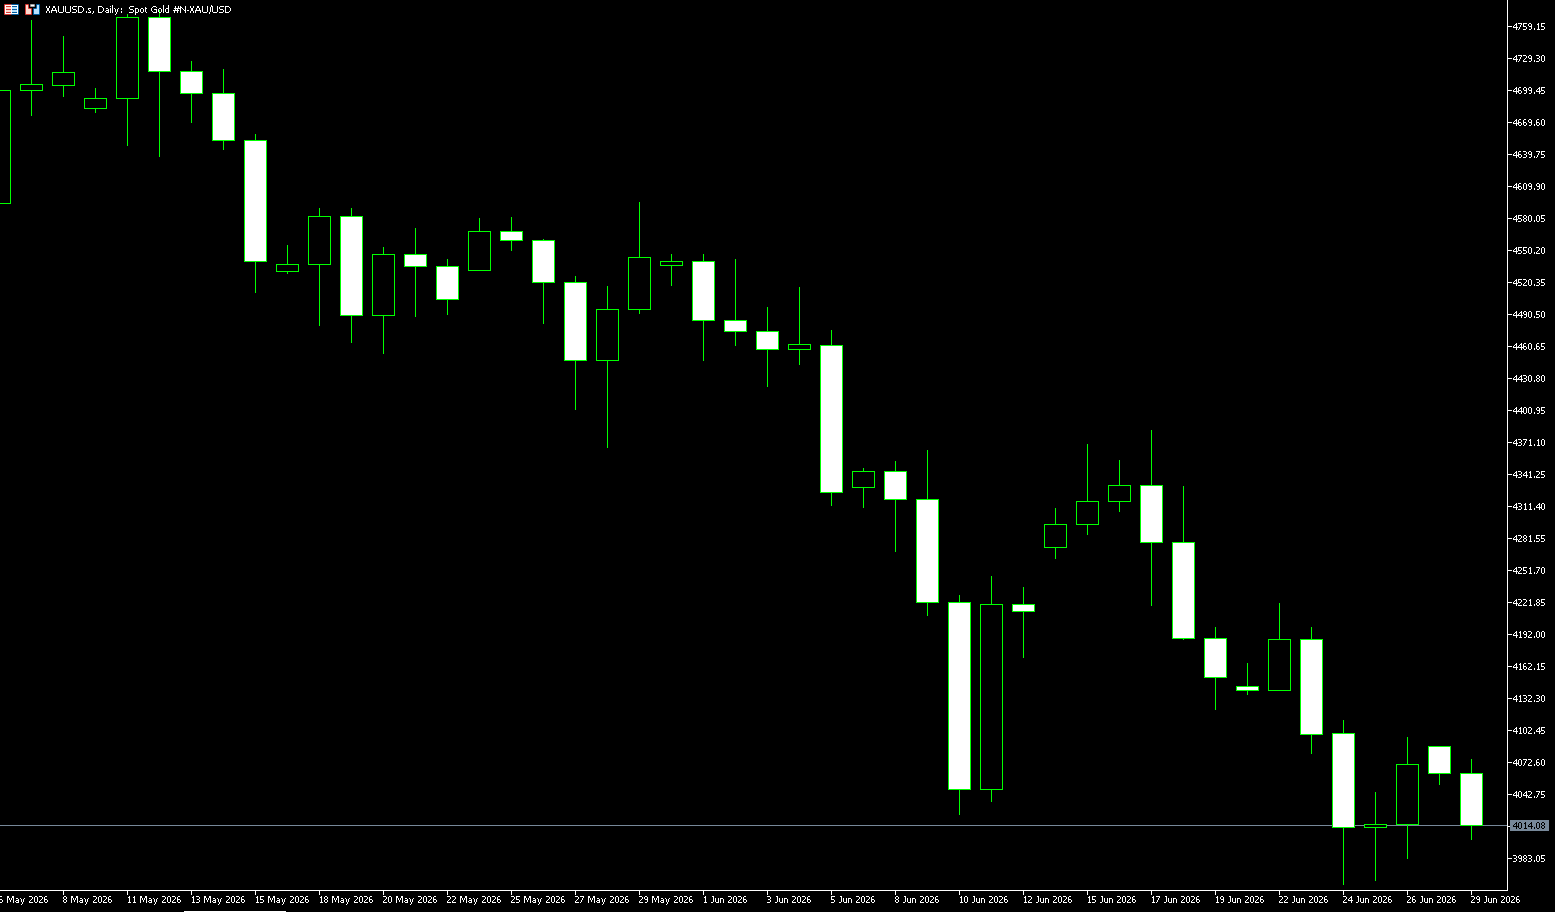
On Monday, spot gold traded around $4,020 per ounce, mainly boosted by a slight easing of interest rate hike expectations and a pullback in the dollar from recent highs. Last week's international gold market can be described as "thrilling." Spot gold experienced a sharp sell-off at the beginning of the week, briefly falling below the $4,000 mark to a more than seven-month low near $3,959 per ounce. However, in the latter part of last week, gold prices gradually stabilized, and before the end of the week, they launched a "comeback." At the beginning of this week, spot gold regained the $4,000 per ounce level after a series of sharp declines. Currently, gold prices are around $4,020-$4,030 per ounce. The direct trigger for this rebound was that while US inflation data remained high, it did not significantly exceed market expectations. The personal consumption expenditure price index rose 0.4% month-on-month in May. Therefore, the rebound in gold prices near $4,000 is more like a "cooling of interest rate fears" rather than a renewed strengthening of the macroeconomic narrative. As a non-interest-bearing asset, the most sensitive variables for gold remain real interest rates and dollar liquidity. When the market corrects from the Fed's "rapid rate hikes" to "still tight but with an uncertain pace," short covering will push up gold prices. However, if the 10-year US Treasury yield continues to remain above 4.3%, gold's valuation anchor will remain under pressure.
Looking at the daily chart, spot gold is currently priced at around $4,020/oz, still below the Bollinger Bands midline of $4,228/oz, and the upper band has moved down to $4,510/oz, indicating that the medium-term trading channel continues to compress downwards. The lower band is around $3,946/oz, and the recent low of $3,959.50/oz is almost right next to it, showing that the $4,000 area has become a psychological and technical convergence zone where bulls and bears repeatedly fight. The MACD histogram is still in negative territory, indicating that the trend correction is not yet complete. More notably, after gold prices retreated from around $4,600, the rebound highs have been progressively lower, with key support levels at $4,000 (a psychological level) and the $3,959.50 area (last week's low). Only when prices approach and hold above the Bollinger Band middle line at $4,228 will the market reassess the possibility of gold prices returning to the $4,300 level.
Today, consider going long on gold at 4,010, with a stop loss at 4,005 and targets at 4,055 and 4,070.
AUD/USD
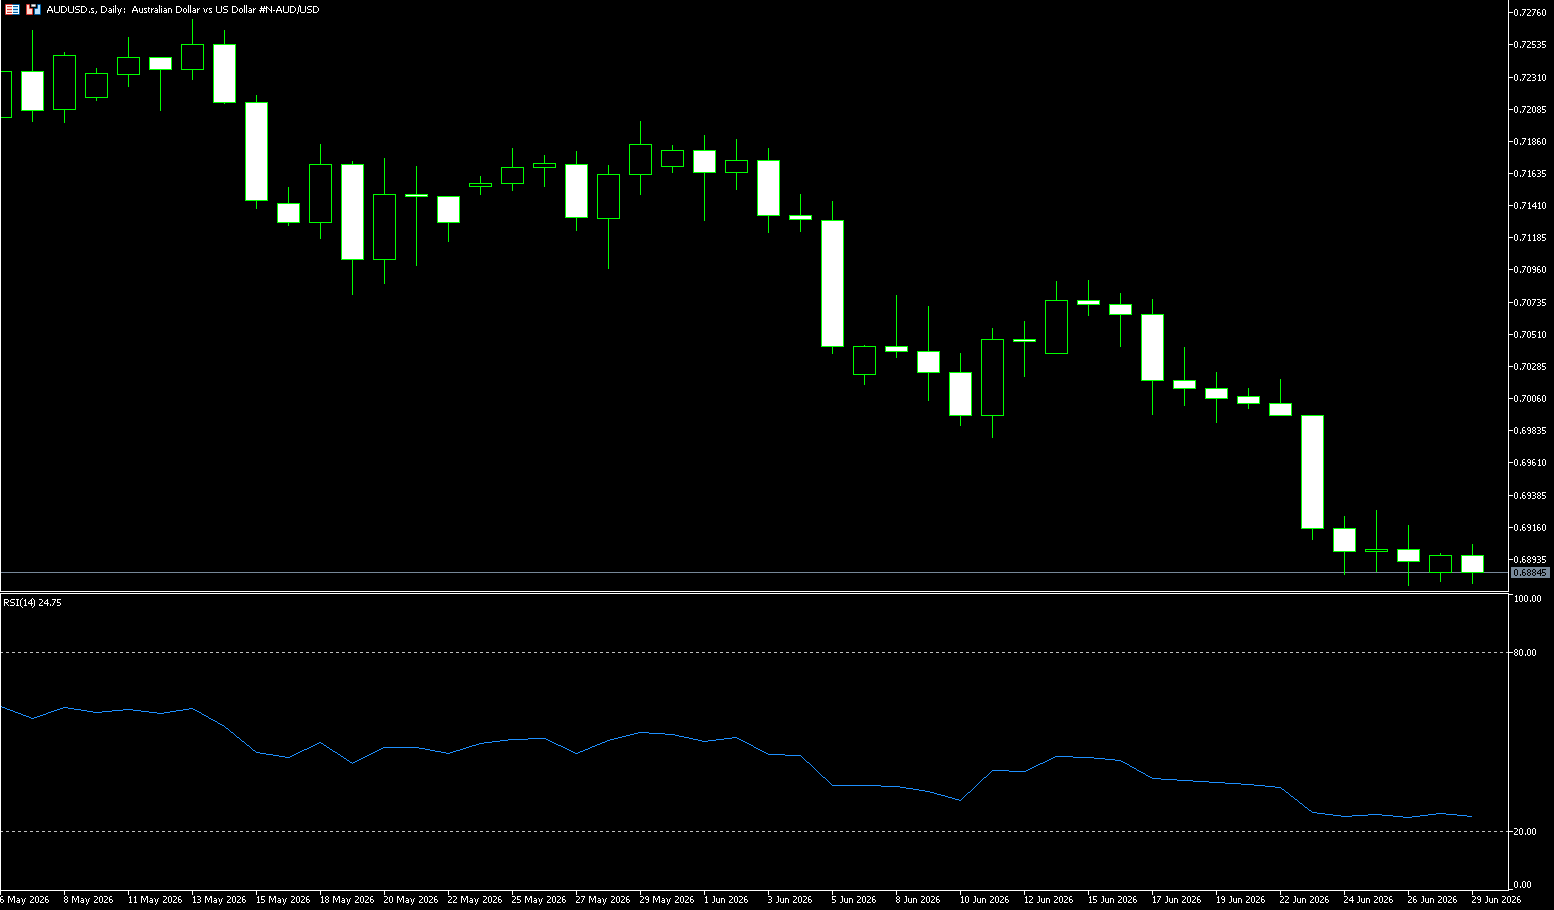
The AUD/USD pair was flat around 0.6885 during Monday's Asian morning session. Traders continued to assess the latest developments regarding the end of negotiations between the US and Iran. The Reserve Bank of Australia will release the minutes of its monetary policy meeting on Tuesday. Market focus will be on the US jobs report to be released later on Thursday. Reuters reported on Sunday that the US and Iran agreed to suspend recent hostilities in the Gulf region and resume negotiations on the Strait of Hormuz dispute. The two sides plan to meet in Qatar on Tuesday. This comes after several days of attacks and retaliations between the two sides following an Iranian ballistic missile striking a cargo ship in the Strait of Hormuz on Thursday. Washington and Tehran both accused each other of violating the temporary ceasefire agreement reached on June 17. However, uncertainty remains high, and any signs of escalating tensions in the Middle East could support safe-haven currencies such as the US dollar and create resistance for this currency pair.
Given the continued high level of uncertainty, any signs of escalating tensions in the Middle East could support safe-haven currencies like the US dollar and act as resistance for this currency pair. The Australian dollar weakened against the US dollar around 0.6890, maintaining a short-term bearish bias as the spot price remained below the 20-day moving average of 0.7017. The pair has slipped below short-term trend indicators, and the Relative Strength Index (RSI) is at 27.56, in oversold territory, suggesting that while downward pressure is dominant, the recent decline has become excessive. On the upside, initial resistance lies at the 9-day simple moving average around 0.6950, and the 0.7000 psychological level; a retest of this level is needed to alleviate the immediate bearish sentiment. On the downside, the 200-day simple moving average at 0.6860 and the March 30 low of 0.6833 will be key support areas; a break below these levels would put the pair under pressure at the psychological support level of 0.6800.
Consider going long on the Australian dollar at 0.6874 today, with a stop loss at 0.6862 and targets at 0.6930 and 0.6940.
GBP/USD
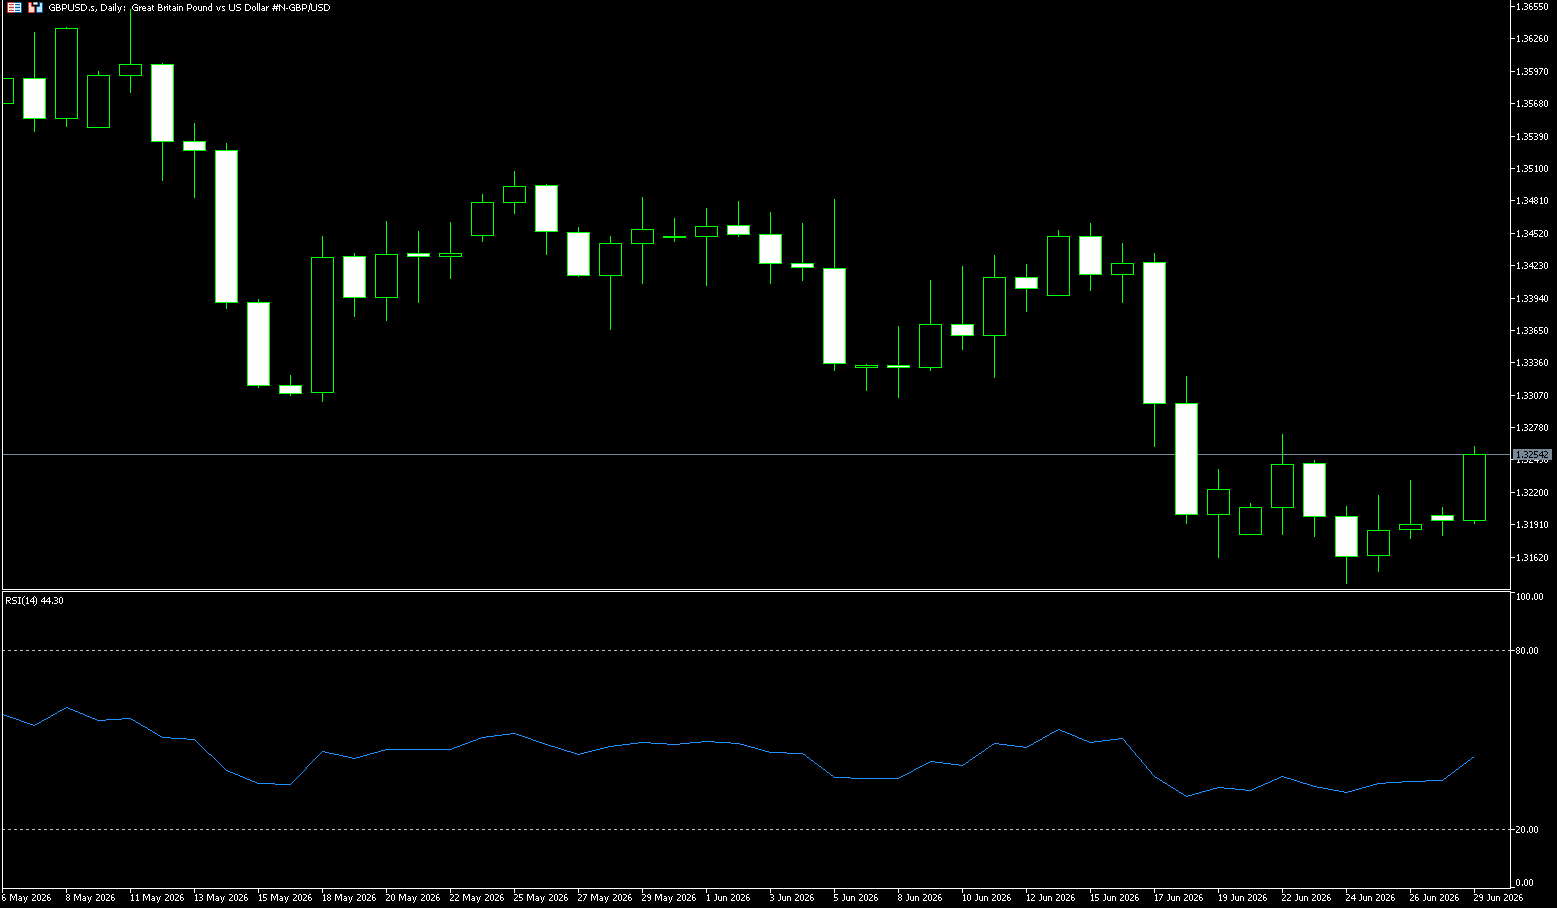
GBP/USD traded around 1.3250 on Monday. The pair weakened against the dollar due to emerging safe-haven demand, which may be related to uncertainty surrounding US-Iran negotiations. Market participants are highly sensitive to evolving news in the Middle East, assessing the region's stability and its broader impact on global risk sentiment. Reuters reported on Sunday that the two countries have agreed to a temporary halt to recent hostilities in the Gulf and resume discussions on the ongoing dispute in the Strait of Hormuz. Official delegations from both countries are scheduled to meet in Qatar on Tuesday to discuss ending the conflict. In the UK, following Keir Starmer's resignation as Labour Party leader under political pressure, newly sworn-in MP Andy Burnham will outline his national vision on Monday. As the leading candidate to succeed the ruling party, the lack of other competitors could allow the former Mayor of Greater Manchester to take office as Prime Minister as early as July 17.
The daily chart shows GBP/USD currently trading around 1.3500, with a short-term bearish bias, as the spot price remains below the triple cluster of simple moving averages (50, 100, and 200-day moving averages) around 1.3431. The pair has broken below the rising support line that started around 1.3159, while the upside resistance levels are above the breakout points of the rising and falling trend lines at 1.3300 (psychological level) and 1.3317 (20-day simple moving average), suggesting that the recent downtrend is still ongoing. The Relative Strength Index (RSI) (14) is around 36.10, below the midline, indicating limited bullish momentum and no significant oversold condition yet. The next support levels are the previous trendline starting point at 1.3159, the lower Bollinger Band at 1.3120, and the psychological level of 1.3100. A break below 1.3100 could lead to a further decline towards the psychological level of 1.3000.
Today, consider going long on GBP at 1.3240, with a stop-loss at 1.3230 and targets at 1.3285 and 1.3300.
USD/JPY
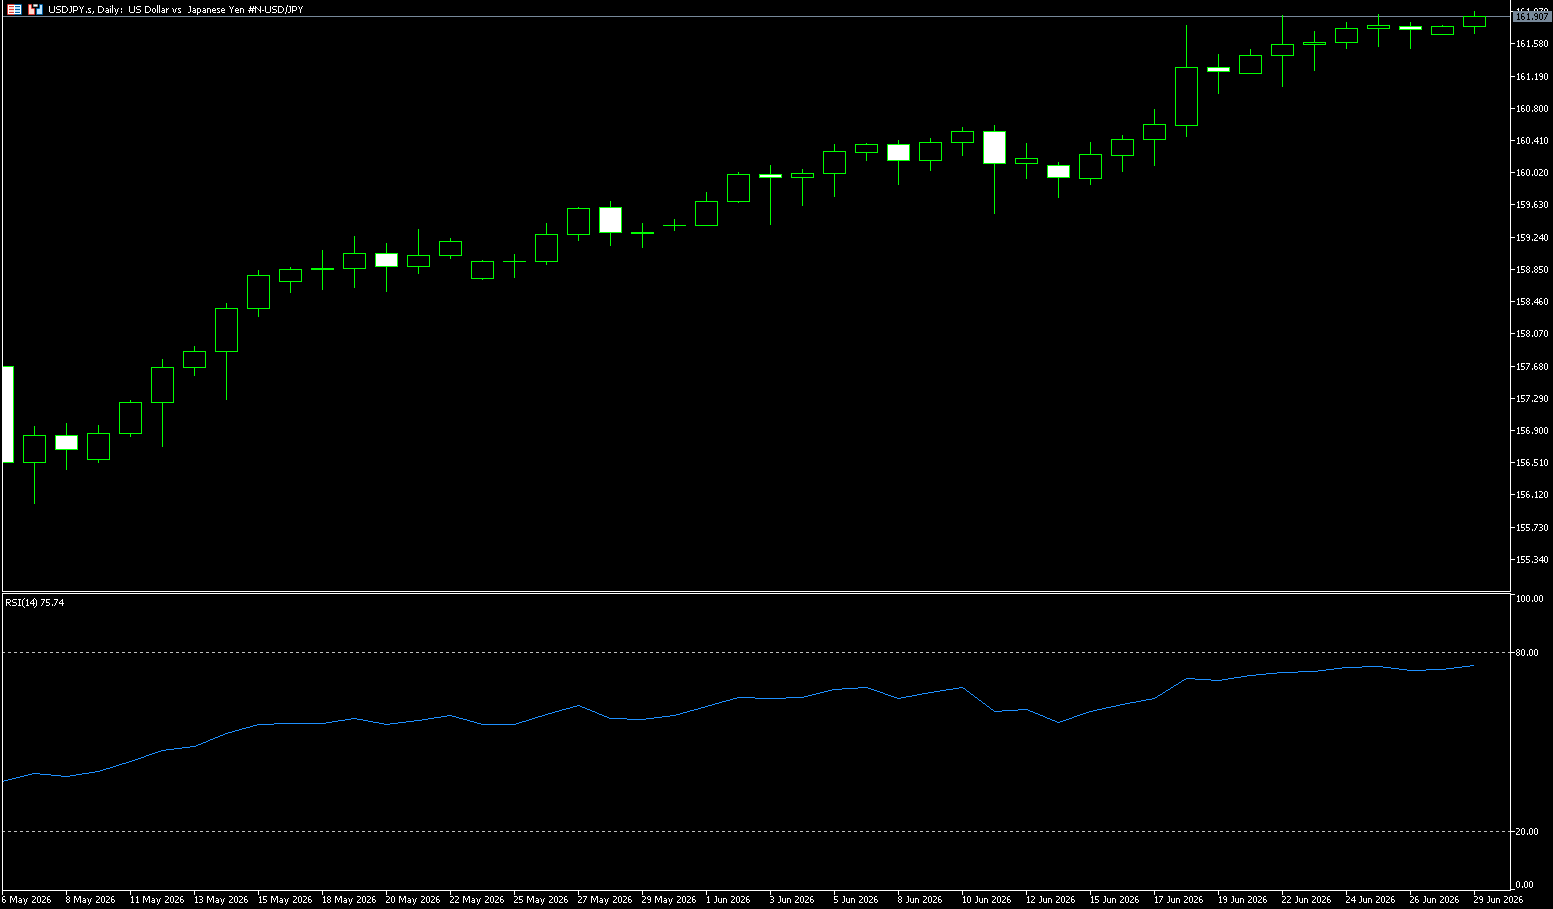
The USD/JPY pair rose to 161.93 last week, just shy of its all-time high of 161.96 since 1986. It has risen in six of the past seven weeks. A break above 161.96 would mark a near 40-year high. The yen's vulnerability stems from the massive interest rate differential of over 500 basis points between the USD and Japan. The Federal Reserve's benchmark interest rate remains at 3.50%-3.75%, while the Bank of Japan's rate is still only 1%. The Federal Reserve's tightening expectations remain strong, and its continued balance sheet reduction supports US Treasury yields, while the Bank of Japan's tightening efforts are relatively weak, with carry trades continuing to put pressure on the yen. Upward pressure on the yen is expected to persist. Japanese authorities are not indifferent. Japanese Finance Minister Satsuki Katayama held an online meeting with US Treasury Secretary Bessenter on Monday evening, focusing on policy responses to the yen's weakness, which may include foreign exchange market intervention. Markets warn that the threat of intervention only slows, not reverses, the yen's depreciation trend. If the Fed raises interest rates this year, the USD/JPY pair could rise to 165.
The daily chart shows that the Relative Strength Index (RSI) has fallen from its previous extreme state to near neutral. Furthermore, the Moving Average Convergence Divergence (MACD) indicator is slightly below zero. Momentum indicators collectively suggest weakening upward momentum, rather than a full reversal. Meanwhile, the focus remains on whether the USD/JPY pair can continue to consolidate above these support levels, which would maintain the overall bullish structure and open the door to further gains once momentum stabilizes. On the upside, bulls are approaching the 162.00 level, with multi-year highs just below. A clean break above this level would open up space towards 162.50 and 163.00, but with each upward step, the likelihood of verbal warnings turning into actual yen buying decreases. Initial support levels on the downside are around 161.10 (10-day moving average) and 161.00 (psychological level). If pressure continues and prices fall, the first target is 160.57 (20-day moving average), and a break below that would test the psychological level of 160.00. Unless there is intervention or weak US non-farm payroll data, these levels are unlikely to be reached.
Consider shorting the US dollar at 162.05 today, with a stop loss at 162.20 and targets at 161.20 and 161.30.
EUR/USD
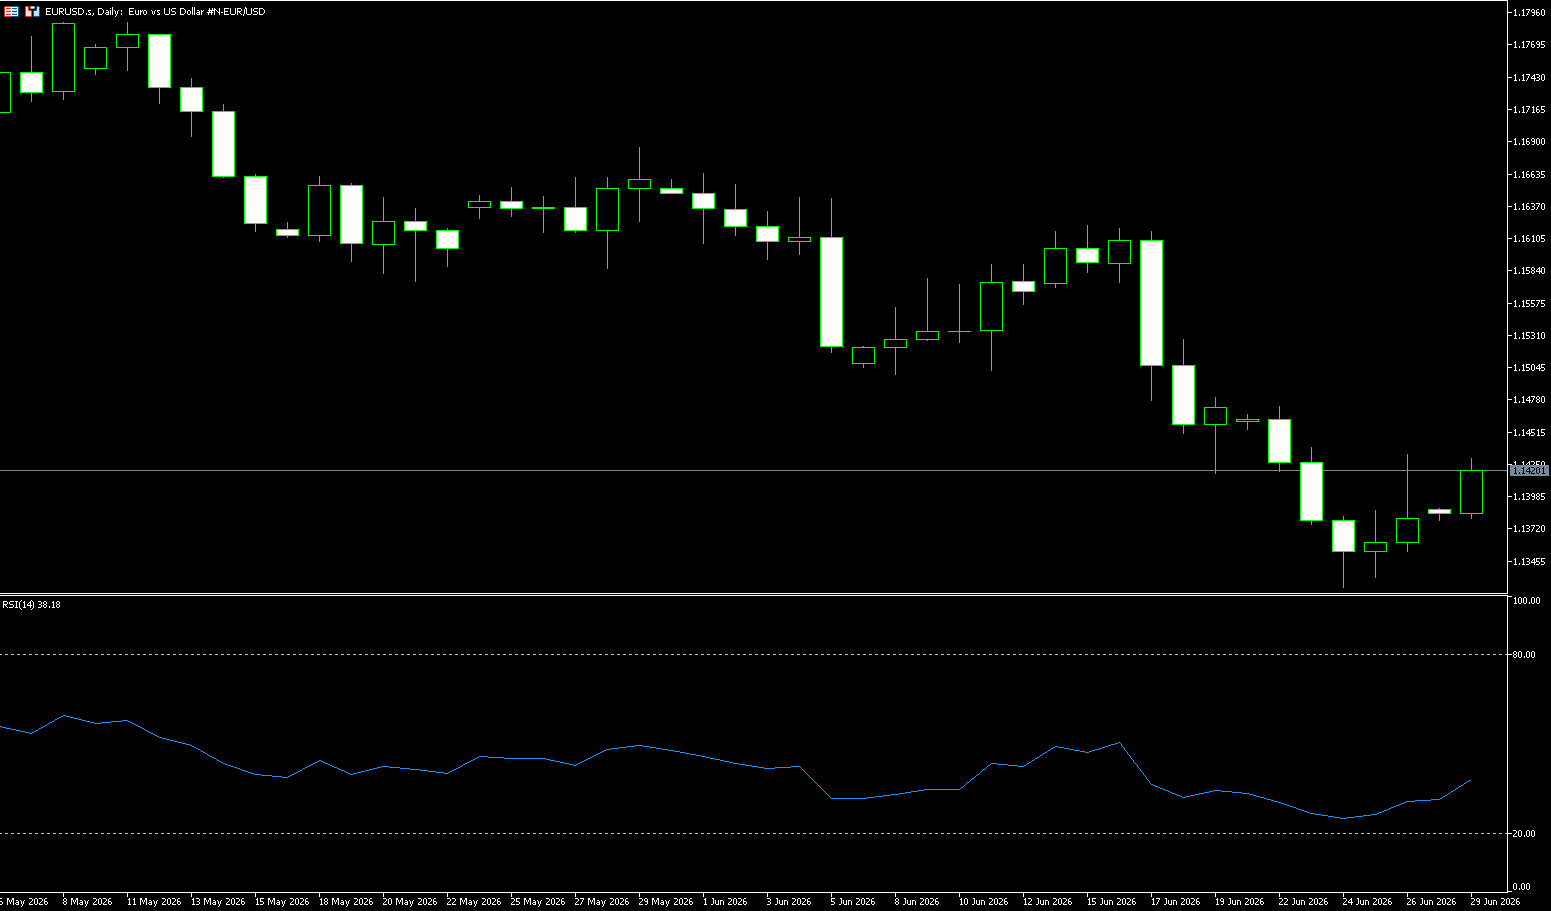
The EUR/USD pair has maintained its upward momentum for the third consecutive trading day, trading around 1.1420 during Monday's Asian session. Despite the positive trend, the euro's gains could face headwinds if geopolitical uncertainty triggers risk aversion and strengthens the dollar. Market participants are highly sensitive to the latest developments in the Middle East, assessing the region's stability and its broad impact on global risk sentiment. The main geopolitical focus is currently on the volatile situation between the US and Iran. Reuters reported on Sunday that the two countries have agreed to temporarily suspend recent hostilities in the Gulf and resume negotiations on the ongoing dispute over the Strait of Hormuz. This diplomatic breakthrough comes after days of retaliatory strikes following Thursday's Iranian missile hit a cargo ship, leading Washington and Tehran to accuse each other of violating the temporary ceasefire agreement reached on June 17. Official delegations from both countries are scheduled to meet in Qatar on Tuesday to discuss ways to end the conflict.
Recent failures to hold above the 100-period simple moving average (1.1498) on the 4-hour chart, and the lack of any meaningful upward momentum for EUR/USD, are bearish factors. Furthermore, the Relative Strength Index (RSI) is near 50, suggesting a gradual recovery from oversold conditions rather than a bullish reversal. Meanwhile, the Moving Average Convergence Divergence (MACD) indicator has now turned slightly positive; however, the EUR/USD remains under structural pressure in the short term. This, in turn, suggests that any meaningful attempt to rally could still be seen as a selling opportunity and risk ending quickly. Immediate resistance lies in the 1.1473 area (last week's high); a break above this level could see the EUR/USD rise back to the 100-period simple moving average at 1.1498. A break above this resistance is necessary to alleviate the current bearish sentiment and pave the way for a more meaningful upward correction. On the downside, watch the 1.1324 area (last week's low) and the 1.1300 psychological level.
Today, consider going long on the Euro at 1.1415, with a stop-loss at 1.1405 and targets at 1.1460 and 1.1470.
Stock Analysis:
Australian ASX 200 Stock Index
Basic Market Overview:
The Australian ASX 200 index rose 59 points, or 0.7%, to close at 8,823 on Monday, extending its strong performance from the previous session. This was driven by a surge in US stock index futures as reports surfaced that Washington and Tehran had agreed to cease hostilities and resume peace talks. Strong growth in Chinese industrial profits for the first five months of 2026 boosted market sentiment, highlighting the resilience of Australia's major trading partner. However, cautious sentiment was evident in both official and private surveys ahead of China's June PMI data to be released later this week. Meanwhile, the Reserve Bank of Australia's June meeting minutes will be released, raising concerns that the central bank may maintain its tightening policy stance to curb inflation. Business services, consumer goods, and healthcare led the gains. Strong iron ore prices supported BHP Group (up 1.4%) and Fortescue (up 2.4%). Ramelius Resources rose 2.3% after agreeing to sell its Edna May gold mine. Neuren Pharmaceuticals shares surged 36.1% after its Rett syndrome drug received EU approval.
Sector Performance:
Leading Sectors (from highest to lowest gain)
1. Information Technology (XIJ) +4.5% (Strongest performer)
Core Driver: Funds bought on dips after last week's sharp declines, and a slight rebound in the Nasdaq overnight boosted growth technology stocks.
Leading Stocks:
• WiseTech Global (WTC) +7.1%
• Xero (XRO) +4.2%
• NextDC (NXT) +3.3%
• Life360 surged 11.1%
2. Consumer Discretionary (XDJ) +3.6%
Positive Factors: Market bets on the end of the Reserve Bank of Australia's rate hike cycle, leading to lower bond yields and a surge in interest rate-sensitive retail and gaming sectors.
Strong performers: Wesfarmers, Harvey Norman, Super Retail Group, and gaming stock Light & Wonder all rallied.
3. Healthcare (XHJ) +3.2%
Catalyst: Favorable European regulations for rare disease drug companies led to increased defensive fund allocation.
Top performers: Neuren Pharmaceuticals +28.1%; heavyweight leader CSL broke through the AUD 100 mark, reaching a new high.
4. Real Estate Investment Trusts (XPJ) +1.8%
Long-term bond yields declined, and valuations of real estate and rental properties recovered, leading to gains for Lendlease, Stockland, and community rental companies.
Lagging sectors (only one sector closed lower):
Materials & Mining (XMJ) -1.1% (the only sector to decline in the entire market)
Reason for decline: Market concerns about another Fed rate hike in July put pressure on commodities, with weak iron ore and copper prices suppressing mining stocks.
Stocks under pressure: BHP Billiton, Rio Tinto, South32, Mineral Resources, and Alcoa all declined; gold mining stocks followed gold prices with a slight pullback.
Technical Analysis:
Monday's closing data for the Australian ASX 200 stock index: closed at 8823.4 points, a daily increase of 0.68%, with an intraday range of 8764.2~8823.4. The opening price was the intraday low, followed by a one-sided upward trend with a trading volume of 714 million lots, indicating a mild volume-driven recovery. The opening price of 8764.2 directly absorbed the support from last Friday's low, without any further decline. The bulls firmly established themselves above the short-term support level of 8780. Fueled by easing geopolitical tensions in the Middle East, the technology sector led the rise, driving the index higher. The intraday average price line acted as strong support throughout, with pullbacks not falling below the average price, indicating that the bulls dominated the market. Last week saw a sharp drop of 5.2%, indicating a deep oversold condition in the short term. Today, funds quickly replenished the market, with Xero and Life360 surging. Sectors showed the strongest index elasticity, but their low weighting makes it difficult for them to break out of the trading range independently. The RSI (14) rose from 40 to 52 intraday, moving out of the oversold zone, indicating sufficient but not overextended rebound momentum. Last week's low was 35, indicating oversold conditions, and Monday's move was a standard oversold correction signal.
The MACD bearish momentum is weakening, but a golden cross has not yet formed. If it subsequently rises above 8850, a daily golden cross is expected, initiating a sustained rebound. The volume-price relationship shows a moderate increase in volume during the rebound, with no signs of a large-scale sell-off. The reduced volume during the pullback phase indicates limited selling pressure above, with the main selling pressure coming from previously trapped investors seeking to exit their positions.
Trading Strategy:
The following are technical trading ideas only and do not constitute investment advice. Leveraged trading may result in losses exceeding the principal.
Bull Scenario (High Probability):
A firm hold above 8800 support, followed by a breakout with volume above 8850 (20-day moving average), targets the upper edge of the 8890-8910 trading range; a break above 8910 could lead to a further rise to 8970.
Bear Scenario (Caution Required):
Failure to break above 8830, followed by a intraday pullback below the 8790 moving average support, signals the end of the rebound and a return to the 8760-8780 range; a decisive break below the 8765 low would trigger a second test of the strong support at 8720.
Key Risk Warnings:
External Risks: Continued weakness in US tech stocks, recurring geopolitical conflicts in the Middle East, and weaker-than-expected Chinese iron ore demand will suppress resource-weighted stocks.
Internal Risks: Strong Australian employment data fuels expectations of further RBA rate hikes, weighing on the financial and real estate sectors.
The index is currently in a high-level consolidation range, with valuations above historical averages. The sustainability of the rebound is questionable, and chasing highs carries significant risk.
Nikkei 225 Index (JP225)
Basic Market Overview:
The Nikkei 225 index rose 0.15% to close at 69,468 points, while the broader Topix index rose 0.47% to 3,982 points, reversing earlier losses on Monday as bargain hunters returned to buy undervalued stocks. Investors are also closely watching developments in the Middle East following renewed clashes between the US and Iran near the Strait of Hormuz, despite both sides agreeing to suspend further attacks ahead of peace talks this week in Doha, Qatar. Domestic data shows that Japan's retail sales grew by 5.3% in May, the fastest pace since November 2023, mainly driven by government stimulus measures that boosted consumer spending. In terms of individual stocks, Pacific Oil & Electric (10.9%), Tokyo Electron (2.4%), Sony Group (3.1%), Nintendo (5.3%), and Disco Inc. (1.3%) all recorded strong gains.
Sector Performance:
Leading Gains:
Today's Leading Sectors (Funds Hedging):
1. Utilities / Electricity & Gas: Short-term yen volatility and high US Treasury yields led to a flow of funds into high-dividend defensive sectors. Electricity and city gas sectors closed higher across the board, making them the strongest performing sector of the day.
2. Traditional Banks & Integrated Financials: Rising Japanese bond yields benefited net interest margins, with heavyweight financial institutions such as Mitsubishi UFJ and Sumitomo Mitsui supporting the index.
3. Land Transportation & Warehousing & Logistics: Stocks with stable domestic demand and cash flow saw increased holdings by institutions during quarterly portfolio adjustments.
Leading Gainers of the Day:
• J.Front Retail (department stores and consumer goods) and Sapporo Holdings (alcoholic beverages) bucked the trend and strengthened.
• Traditional heavy industry and transportation machinery saw slight gains.
Leading Losers:
Today's Leading Losers (AI/Semiconductors See Profit-Taking):
1. Electrical Equipment/Semiconductor Hardware (Biggest Drag of the Day): Previously high-flying computing power, storage, and chip equipment stocks saw a collective sell-off: Kioxia, Advantest, Tokyo Electron, and Shin-Etsu Chemical all weakened; foreign investors reduced their holdings in technology growth stocks at high levels, with a clear profit-taking wave at the end of June.
2. Non-ferrous Metals and Metal Processing: Global risk appetite declined, putting pressure on industrial metal prices; Mitsui Metals and Furukawa Electric saw the largest declines.
3. Information and Communication and Internet Software: High-valuation technology growth stocks also corrected; SoftBank Group weakened, dragging down the index weighting.
Leading decliners of the day:
Kioxia, Furukawa Electric, Mitsui Metals, Ibiden (semiconductor materials), CyberAgent (internet platform).
Technical Analysis:
The Nikkei 225 closed at 69,468.11 on Monday, a slight increase of +0.15% (+107.23 points). The index experienced significant intraday volatility: a rapid drop to a low of 67,997 in the morning, followed by a recovery in funds towards the close. The day showed a divergence between profit-taking in high-flying technology stocks and support from defensive value sectors. Trend Background: After a sustained surge to a historical high of 72,000 points, the market entered a period of profit-taking. Last Friday saw a sharp drop of 4.15%. Monday's lower opening and subsequent long lower shadow doji candlestick pattern suggests a short-term bottoming signal, but the medium-term upward trend has been broken, shifting to a weak, high-level consolidation pattern. Technical indicators: RSI (14): It has fallen from the overbought zone of 73 to the neutral zone of 46, indicating that the overbought condition has been digested, but it has not yet entered the oversold zone, raising doubts about the sustainability of the rebound. MACD: The daily chart shows a downward death cross, with the green bars continuing to expand, confirming a medium-term downtrend, with only short-term recovery potential. In terms of volume: the morning decline saw increased volume, while the afternoon recovery saw decreased volume, indicating insufficient buying pressure and that the rebound is a technical bounce rather than a reversal. Until the index firmly establishes itself above the 70100 resistance level or breaks below the 68350 support level, it is advisable to remain on the sidelines and observe. Trading within the range offers a low risk-reward ratio; wait for a breakout before taking action.
Trading Strategy:
Short-term Long Position (Rebound Trading, Primarily Light Position)
1. Entry Conditions: The index stabilizes above 69000, with sustained volume on intraday charts, and stabilizes after a pullback to the 69000-69100 range;
2. Targets: First target 69800-70100, second target 70800;
3. Stop Loss: If the index breaks below 68350 (closing price or trading below this level for two consecutive hours), exit the position;
4. Position Sizing Recommendation: 10%-15% of total capital. Avoid heavy bottom-fishing; only trade within a recovery range.
Shorting with the Trend (Main Strategy for Mid-Term Adjustment, Prioritized)
1. Entry Condition 1 (Short on Rebound with Resistance): A rebound to the 69800-70100 resistance zone stalls, with intraday volume decreasing and a reversal occurs;
2. Entry Condition 2 (Short on Breakout): A decisive break below the 68350 support level with increased volume;
3. Target: First target 67500, extreme downside target 66800;
4. Stop Loss: 300-400 points above the entry price for long positions, strictly set;
5. Position Sizing Recommendation: Limit total capital to 20%, enter in two batches, focusing on resistance levels as the primary battleground for short positions.
Risk Warnings:
US Dollar Exchange Rate Risk (Nikkei's Biggest Variable)
70% of the revenue of Nikkei 225 constituent stocks comes from overseas. A significant appreciation of the yen will directly suppress the profits of export companies, and a rapid rise in USD/JPY will trigger a plunge in the index. Currently, the yen is near a 40-year low, and the Bank of Japan and the Ministry of Finance may intervene in the exchange rate at any time. Sharp exchange rate fluctuations could cause the index to fluctuate erratically by 2%-3% daily.
US-Japan Monetary Policy Interest Rate Differential Risk
Expectations of a Fed rate cut and continued BOJ rate hikes are compressing the US-Japan interest rate differential, leading to a continued withdrawal of carry trade funds from Japanese stocks. The rising yield on 10-year Japanese government bonds is suppressing the valuation of technology stocks, resulting in a double whammy of stock and bond declines and prolonging the adjustment period.
Disclaimer: The information contained herein (1) is proprietary to BCR and/or its content providers; (2) may not be copied or distributed; (3) is not warranted to be accurate, complete or timely; and, (4) does not constitute advice or a recommendation by BCR or its content providers in respect of the investment in financial instruments. Neither BCR or its content providers are responsible for any damages or losses arising from any use of this information. Past performance is no guarantee of future results.
Lebih Liputan


Pendedahan Risiko:Instrumen derivatif diniagakan di luar bursa dengan margin, yang bermakna ia membawa tahap risiko yang tinggi dan terdapat kemungkinan anda boleh kehilangan seluruh pelaburan anda. Produk-produk ini tidak sesuai untuk semua pelabur. Pastikan anda memahami sepenuhnya risiko dan pertimbangkan dengan teliti keadaan kewangan dan pengalaman dagangan anda sebelum berdagang. Cari nasihat kewangan bebas jika perlu sebelum membuka akaun dengan BCR.
BCR Co Pty Ltd (No. Syarikat 1975046) ialah syarikat yang diperbadankan di bawah undang-undang British Virgin Islands, dengan pejabat berdaftar di Trident Chambers, Wickham’s Cay 1, Road Town, Tortola, British Virgin Islands, dan dilesenkan serta dikawal selia oleh Suruhanjaya Perkhidmatan Kewangan British Virgin Islands di bawah Lesen No. SIBA/L/19/1122.
Open Bridge Limited (No. Syarikat 16701394) ialah syarikat yang diperbadankan di bawah Akta Syarikat 2006 dan berdaftar di England dan Wales, dengan alamat berdaftar di Kemp House, 160 City Road, London, England, EC1V 2NX. Open Bridge Limited bertindak semata-mata sebagai pemproses pembayaran untuk BCR Co Pty Ltd dan tidak menyediakan sebarang perkhidmatan kewangan, perdagangan atau pelaburan bagi pihaknya. Peranan Open Bridge Limited adalah terhad kepada pemprosesan pembayaran.

 English
 简体中文
简体中文
 繁體中文
繁體中文
 Bahasa
Melayu
Bahasa
Melayu
 Tiếng
Việt
Tiếng
Việt
 ไทย
ไทย
 日本語
日本語
 한국어
한국어
 ភាសាខ្មែរ
 español
