


0
US Dollar Index
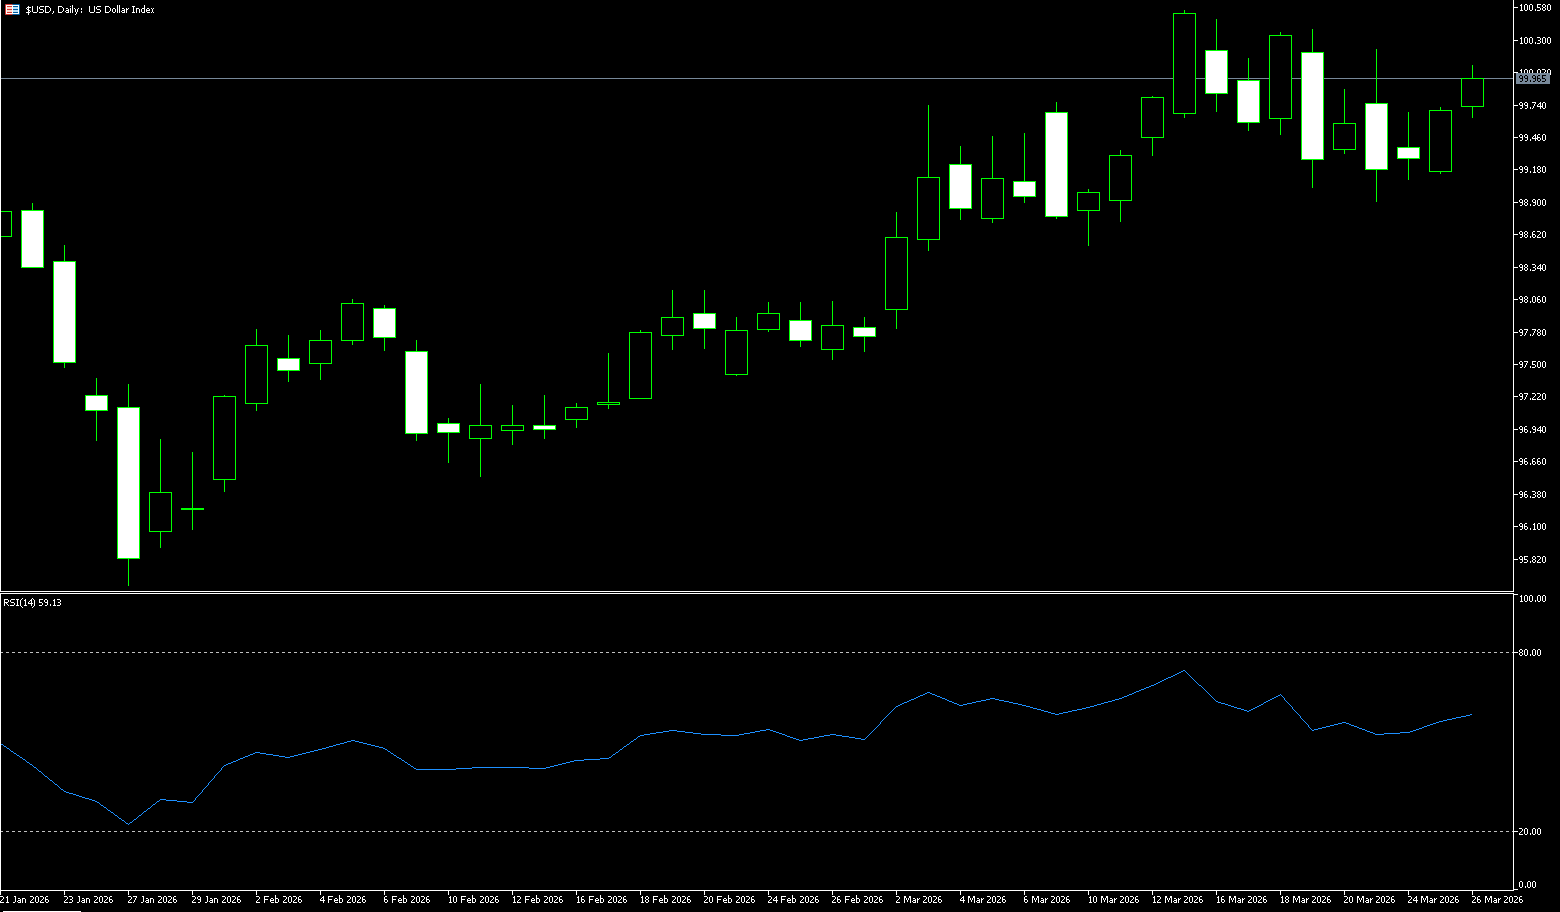
The US dollar strengthened against major currencies mid-week, with the dollar index rising to 99.90, as markets remained skeptical of easing tensions between the US and Iran, and traders weighed global inflation trends and remained cautious. Although Iran is reviewing a US proposal to end the Gulf conflict, Iran's negative response and denial of direct negotiations unsettled investors. Despite the news of easing tensions, the dollar has shown resilience. Why has the dollar recently been weaker than US Treasury yields, or does the recent dollar weakness represent market bets on an impending end to the war? The current situation in the Middle East continues to disrupt global financial markets. The power struggle between the US and Iran directly affects the dollar index and US Treasury yields. The US's proposed 15-point ceasefire, while seemingly signaling peace talks, is actually more of a delaying tactic. The significant volatility across various assets and the stabilizing dollar index have become the core focus of the current foreign exchange market.
Amid escalating tensions between the US and Iran and heightened market risk aversion, a clear divergence has emerged in the financial markets: US Treasury yields have continued to rise sharply, while the US dollar index has failed to follow suit, exhibiting a divergence. The logic behind the rise in US Treasury yields is driven by the dual support of inflationary pressures and geopolitical risks. This further limits the Federal Reserve's room for interest rate cuts, and even raises cannot be ruled out. The two-year US Treasury yield, reflecting the Fed's policy expectations, has performed particularly well; higher yields could attract cross-border capital inflows, theoretically becoming a significant force supporting the dollar. Technically, the dollar continues to trade within a range, strongly holding the lower edge of the range at 99.00 (the psychological level) and 98.88 (the early-week low). As the conflict progresses, safe-haven demand will likely continue to dominate its movement. The upper edge of the range lies at 100.00 (the psychological level) and the 100.31 (minor double top) area.
Today, consider shorting the US Dollar Index at 100.00, with a stop-loss at 100.10 and targets of 99.60 and 99.50.
WTI Crude Oil
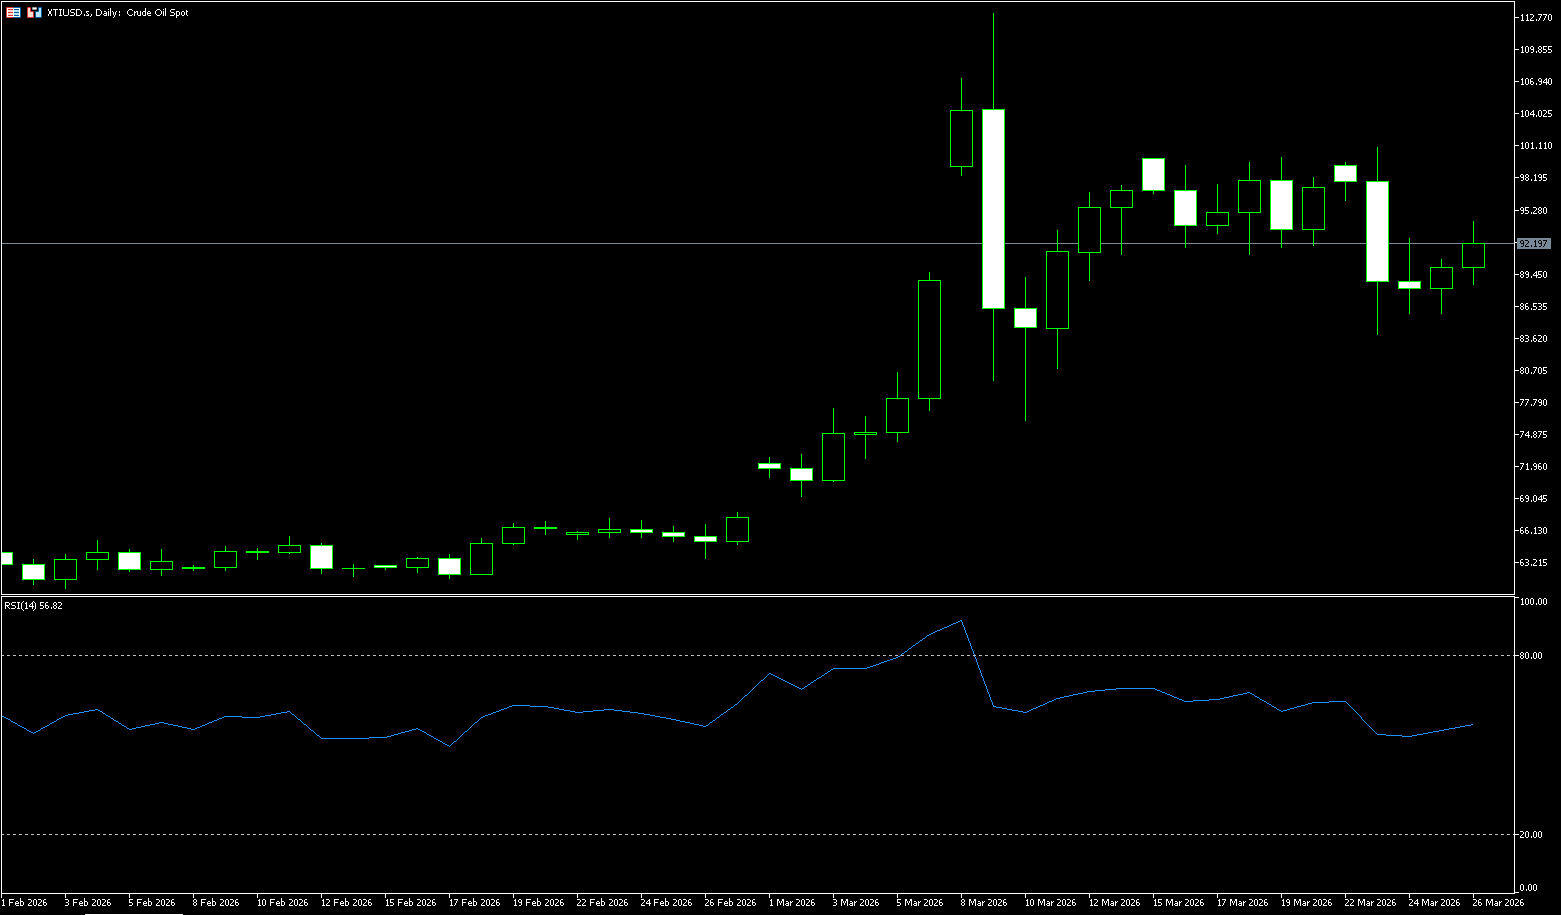
WTI crude oil prices traded above $93.00 per barrel, partially recovering losses from the previous trading day after conflicting statements from the US and Iran regarding efforts to end the conflict, causing turmoil in global energy markets. Iran stated it had no intention of negotiating with the US and would reject a proposed ceasefire, instead presenting its own conditions, including sovereignty control of the Strait of Hormuz. Meanwhile, the White House insisted that peace efforts were ongoing, and Washington reportedly sent a 15-point proposal to Iran through Pakistan aimed at resolving the conflict and reopening this crucial waterway. The near closure of the Strait of Hormuz has severely disrupted global oil flows, resulting in millions of barrels of lost supply daily. While some vessels continue to pass under Iranian protection, US allies in the Asia-Pacific region, including South Korea, Australia, and the Philippines, are facing growing fuel shortages.
Despite the significant drop in oil prices, underlying geopolitical risks in the Middle East remain high, and the physical crude oil market continues to face a supply shortage. The main focus remains on whether the Strait of Hormuz will open, or more specifically, the struggle for final passage rights in the Strait of Hormuz. The market tends to underestimate the protracted nature of the conflict, leading to an excessive correction in oil prices. Technically, WTI crude oil futures continue to consolidate near the 50% Fibonacci retracement level, constrained by Monday's long bearish candlestick. The current candlestick pattern is a descending three-methods pattern, favoring further testing of lower levels by the bears. However, if oil prices continue to test lower levels, panic selling will create good opportunities for long positions. On the upside, watch $93.68 (1-day moving average), followed by $95, which will be a key test of its strength—the price level where the bears previously pushed the price below the middle channel line. In the short term, be wary of a pullback due to risk aversion. A break below the $85.91 (21-day moving average) and $84.00 (psychological level) support zone would further target the $80.00 (psychological level).
Today, consider going long on spot crude oil at 92.40, with a stop loss at 92.20 and targets at 95.00 and 96.00.
Spot Gold
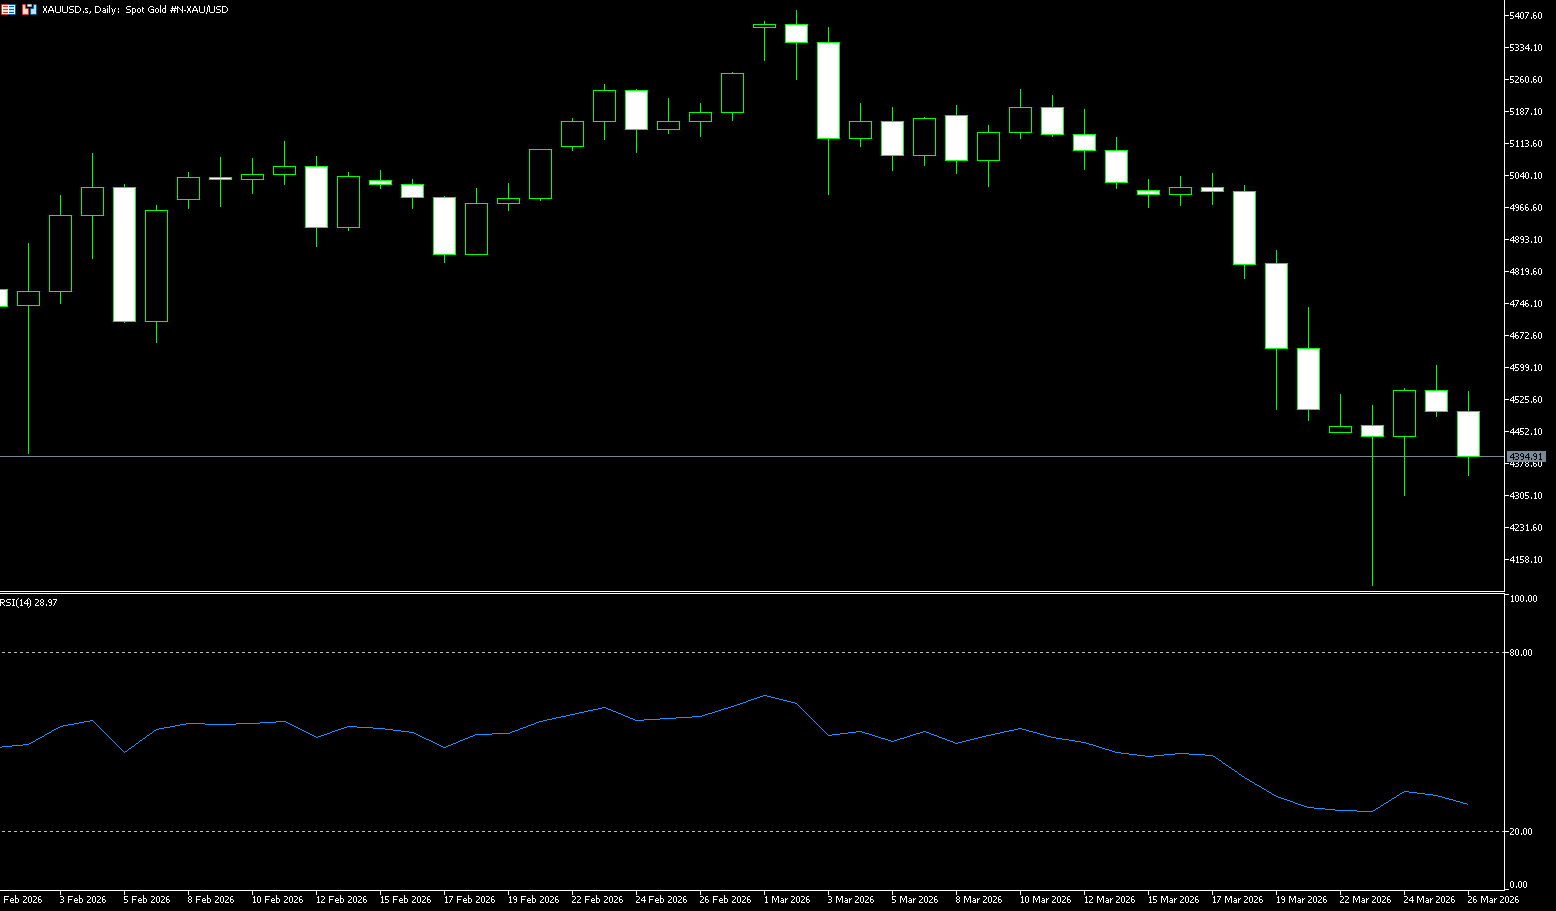
Gold fell below $4,400 an ounce on Thursday, erasing gains from the previous two trading days, as conflicting statements from the US and Iran regarding potential peace talks continued to roil financial markets. Washington insists negotiations are underway, and the Trump administration reportedly sent a 15-point proposal to Iran through Pakistan aimed at resolving the conflict and reopening the Strait of Hormuz. However, Iran stated it has no intention of negotiating with the US and will reject the US ceasefire proposal, instead setting its own conditions, including sovereignty over the strategic waterway. The US has also ordered the deployment of thousands of troops to the Middle East, increasing concerns about a possible ground invasion. Gold has faced strong selling pressure this month as soaring energy prices related to the Iran war have fueled inflation fears and prompted major central banks to adopt a hawkish stance.
Overall, the core contradiction for gold at present is not a trend reversal, but rather a temporary misalignment of timing. In the short term, liquidity demand and ETF holding pressure may still lead to further volatility; in the medium term, short covering may become an important driver of price rebounds; and from a longer-term perspective, inflation risks and geopolitical uncertainties still form the foundation for gold's rise. The market is currently still in the "bottom-finding" phase. Before liquidity pressures and position adjustments are fully released, prices may continue to fluctuate or even face further pressure. In other words, gold has not lost its safe-haven function, but is playing a role in another way—it can be quickly converted into cash when the market needs it most. From a price trend perspective, gold has found some support near the 200-day moving average at 4,113 and 4,098 (this week's low), and has rebounded from the $4,100 area to fluctuate at a high of around $4,602. However, this rebound is more likely to be a technical correction rather than a trend reversal. Therefore, short-term resistance levels to watch are 4,602 (this week's high) and 4,653 (9-day moving average); support levels to watch are $4,400 (psychological level) and $4,367 (150-day moving average).
Consider going long on spot gold today at 4,375, with a stop-loss at 4,370 and targets at 4,450 and 4,480.
AUD/USD
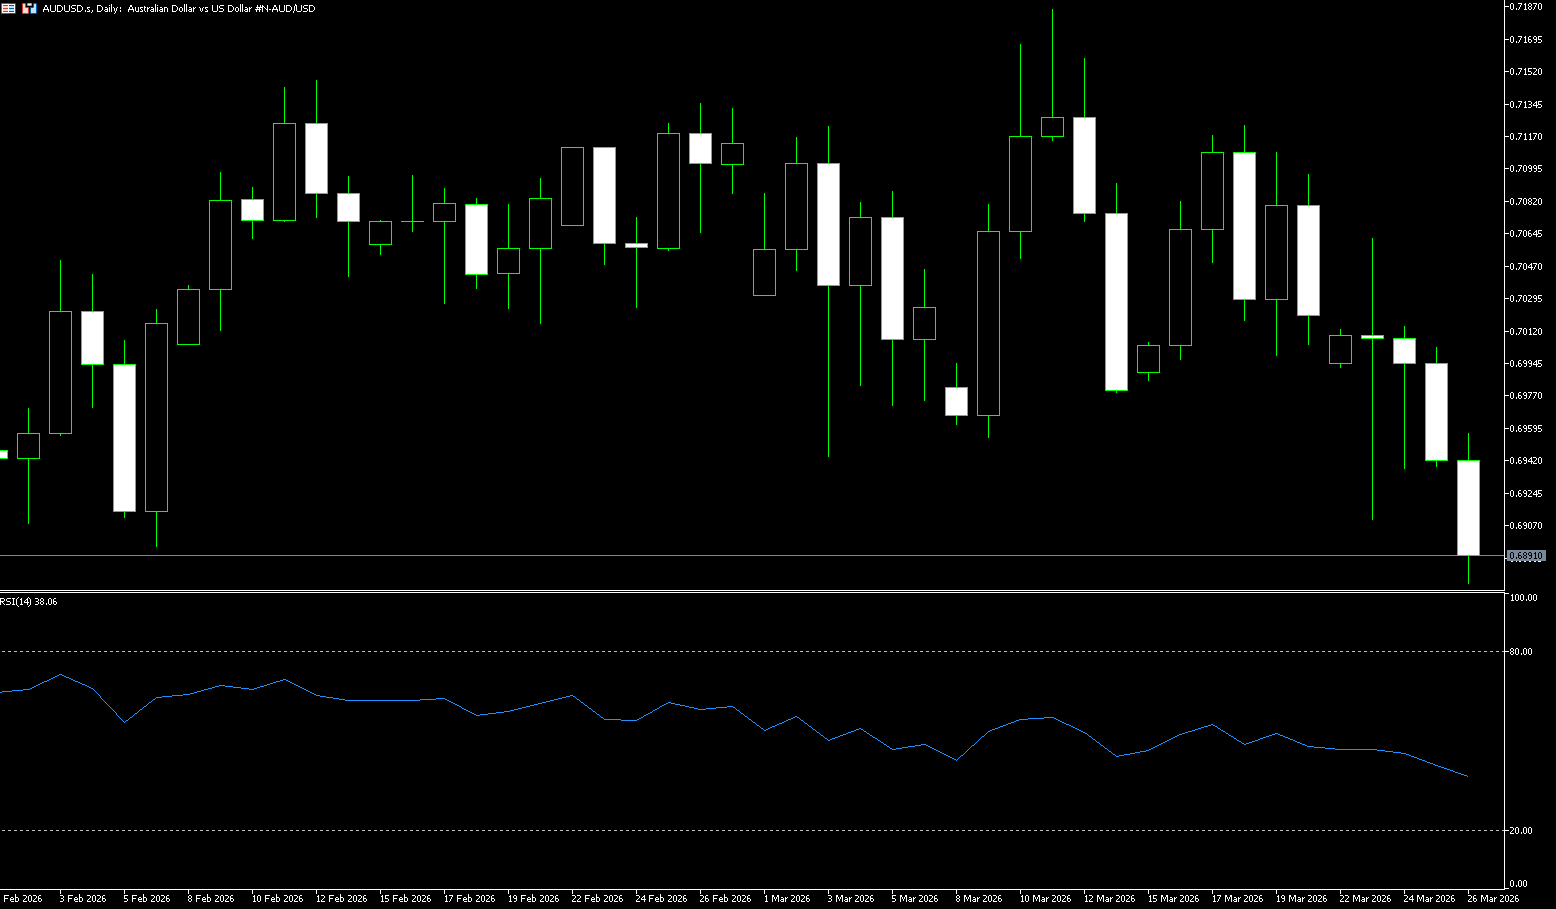
The Australian dollar is trading below US$0.6900, remaining at a seven-week low, as investors remain skeptical of the recent de-escalation of the Iran war, while the Reserve Bank of Australia has warned of rising inflation risks from the global oil shock. The central bank warned that a prolonged conflict-driven supply shock could push up inflation and long-term expectations, potentially requiring a more restrictive policy stance. Assistant Governor Chris Kent noted that such shocks tend to push up prices while putting pressure on economic growth, limiting the ability of policy to fully offset the effects and instead shifting the focus to preventing inflation from becoming entrenched. Meanwhile, uncertainty surrounding the conflict continues to weigh on market sentiment, with the US and Iran sending conflicting signals regarding potential negotiations. While Washington has stated its efforts to push for talks and de-escalate tensions, Tehran has opposed ceasefire proposals, and the increased US troop deployment in the region has heightened concerns about further escalation.
The Australian dollar's upward momentum appears to have weakened in recent days, prompting it to give back some of its recent gains against the US dollar. However, persistently high domestic inflation and the Reserve Bank of Australia's cautious stance should support the currency in the short term. The AUD/USD pair fell for the fourth consecutive day, breaking below the key 0.7000 level again and challenging the lower end of its monthly range. The short-term bias is slightly bearish, with the pair retracing below the 23.6% Fibonacci retracement level of 0.6976, calculated from the 0.6421 low to the 0.7147 high. The daily closing price remains firmly above the rising 100- and 200-day simple moving averages, maintaining the overall upward trend. However, this is contrasted by weakening momentum, as the Relative Strength Index (RSI) has fallen back to the midpoint of 42. This indicates that the previously strong uptrend has turned into a weaker correction phase. Immediate support lies at 0.6900 (a psychological level) and the 38.2% Fibonacci retracement level at 0.6870. If sellers continue to control the market, further downside potential will open up to the psychological level of 0.6800. Initial resistance is at the 23.6% Fibonacci retracement level at 0.6976, followed by the psychological level of 0.7000. A daily close above this resistance zone would neutralize the current corrective tone and refocus attention on the higher resistance level of 0.7283.
Consider going long on the Australian dollar at 0.6885 today, with a stop loss at 0.6870 and targets at 0.6950 and 0.6960.
GBP/USD
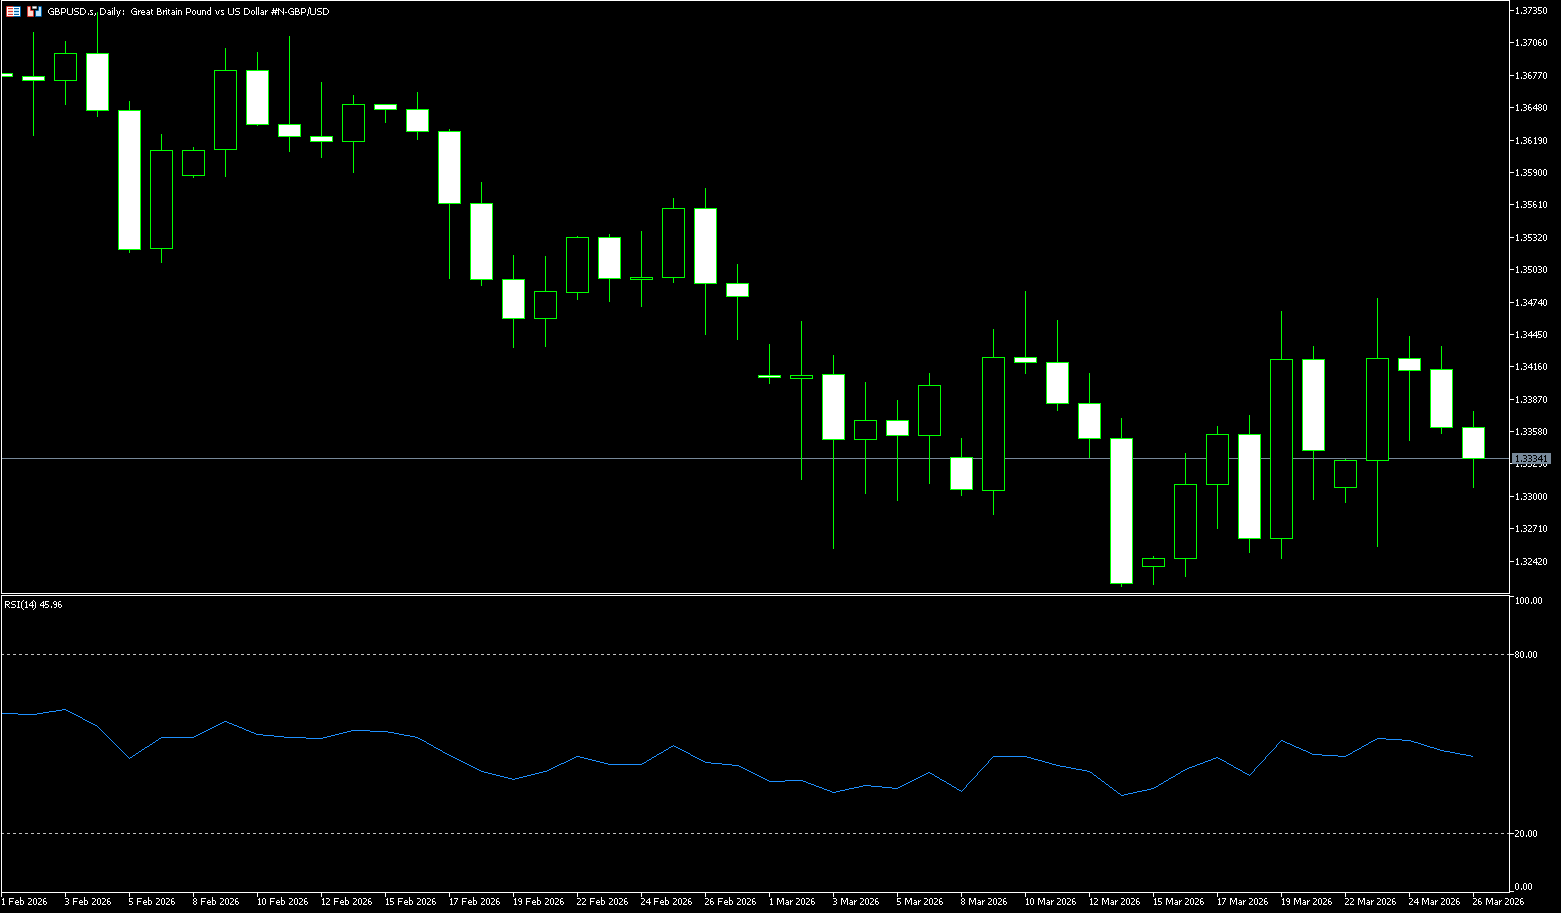
The GBP/USD pair remained stable after two consecutive days of declines, hovering around 1.3340 during Thursday's Asian trading session. The pair held steady as the US dollar remained strong, with traders closely watching developments in the Middle East amid continued uncertainty surrounding efforts to end the war with Iran. The White House stated that negotiations were ongoing, and reports indicated that the Trump administration sent a 15-point proposal to Iran through Pakistan to resolve the conflict. Senior Iranian officials are reviewing the US proposal but have indicated a reluctance to negotiate with Washington. However, Tehran stated it would reject the US ceasefire proposal and instead put forward a five-point plan, including sovereignty control over the Strait of Hormuz. The pound may find support due to lower oil prices, with the market hoping for a de-escalation of tensions in the Middle East. UK inflation data for February showed that overall CPI remained at 3%, in line with expectations, while core CPI rose slightly to 3.2%, exceeding the forecast of 3.1%. However, these pre-conflict data had limited impact on market sentiment.
The daily chart shows GBP/USD trading at 1.3340. The short-term bias is mildly bearish, as the spot price is below the simple moving average cluster around 1.3500, indicating weakening upward momentum after multiple rejections near the descending resistance line at 1.3869. The pair has limited rallies below the mid-1.3600 level, forming a series of lower highs. This suggests that sellers remain in control in the short term. Initial resistance lies at the key 200-day simple moving average supply zone of 1.3432. A break above this area would alleviate the current downside bias, targeting the 1.3480 (Monday's high). Short-term support is currently at the psychological level of 1.3300; a significant break below this area would trigger a deeper pullback, targeting the 1.3255 (lower Bollinger Band on the daily chart) level.
Today, consider going long on GBP at 1.3325, with a stop-loss at 1.3315 and targets at 1.3380 and 1.3370.
USD/JPY
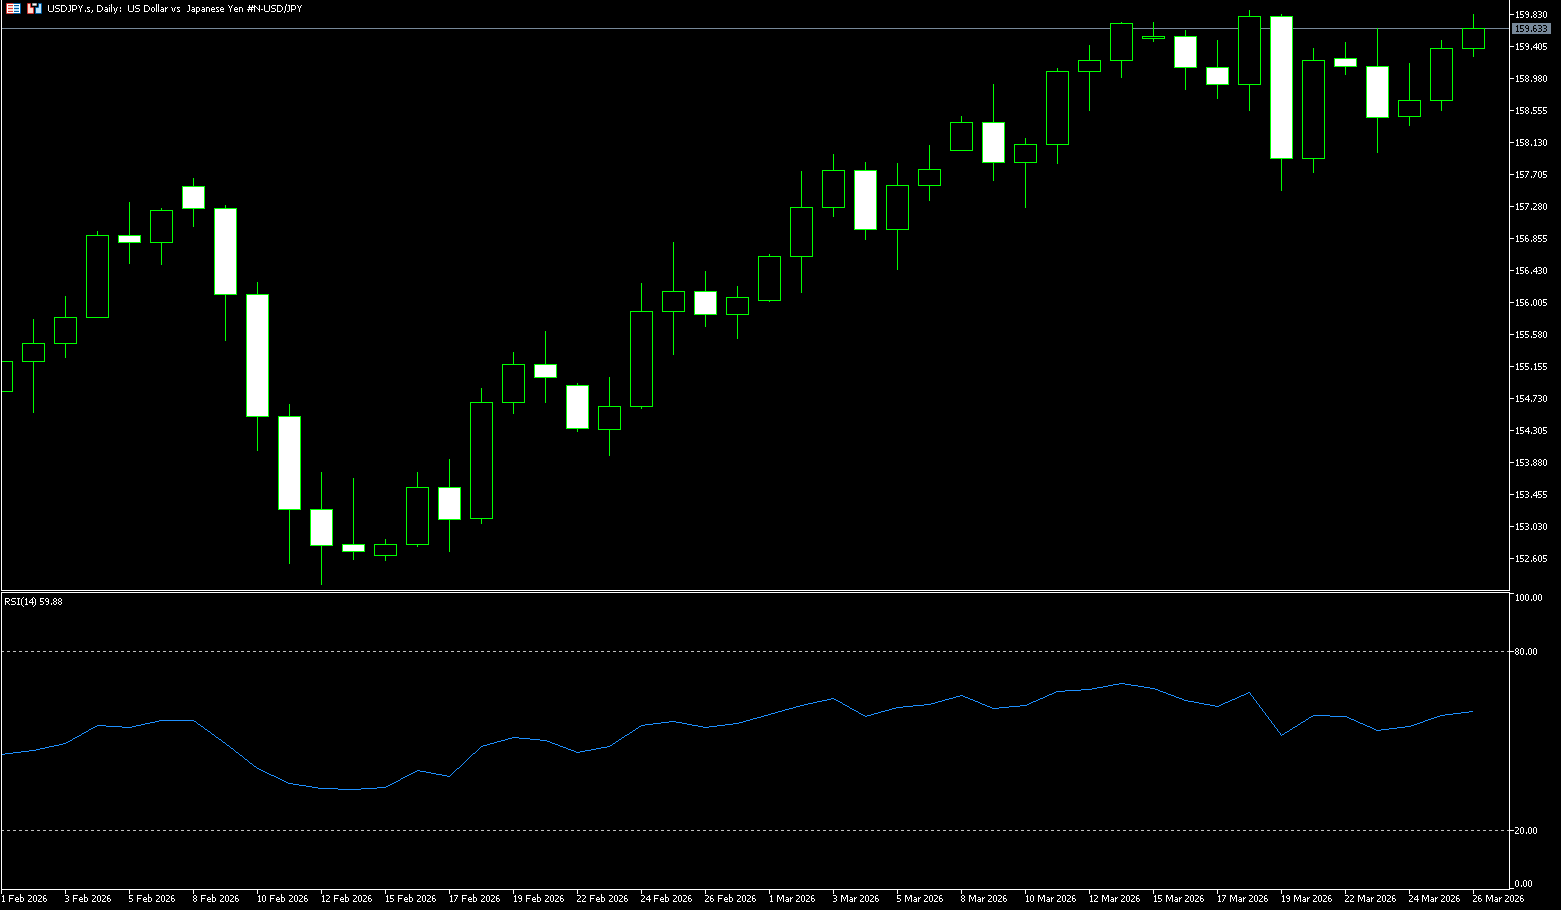
The yen fell to around 159.60 per dollar on Thursday, marking its third consecutive day of losses, as the dollar strengthened amid high uncertainty surrounding diplomatic efforts to resolve the Middle East conflict. The US insisted that peace talks were ongoing, while Iran stated it had no intention of engaging in direct negotiations with Washington. Tehran indicated it would reject the US ceasefire proposal, instead putting forward a five-point plan demanding control of the Strait of Hormuz. The yen was also pressured by a rebound in oil prices, which exacerbated inflation concerns and impacted Japan's growth prospects. Meanwhile, Japan received two oil tankers from the Middle East this week that bypassed the key waterway, easing some supply pressures. A former Japanese national security advisor suggested the country consider deploying warships to work with other countries to secure the waterway and protect its own vessels as well as those of international partners.
The USD/JPY pair continued its upward trend mid-week, testing key support at the 20-day simple moving average around 158.42 on Monday, but failed to break through the key weekly high of 159.75 reached on Monday. Technically, USD/JPY may retest the psychological level of 160, the weekly high, in the short term. The 14-day Relative Strength Index (RSI) is at the 60 level, confirming this momentum. However, market concerns exist regarding potential intervention by US authorities in the foreign exchange market to prevent dollar bulls from pushing the pair towards the 160.00 level and the 161.10 area (the high of July 8, 2024). On the downside, the first area to watch is the 20-day simple moving average at 158.42. A break below this level would open the door to a challenge of the March 19 high of 157.51, while the psychological level of 157.00 becomes the next key defense line for the bulls.
Today, consider shorting the US dollar at 159.85, with a stop loss at 160.00 and targets at 158.60 and 158.80.
EUR/USD
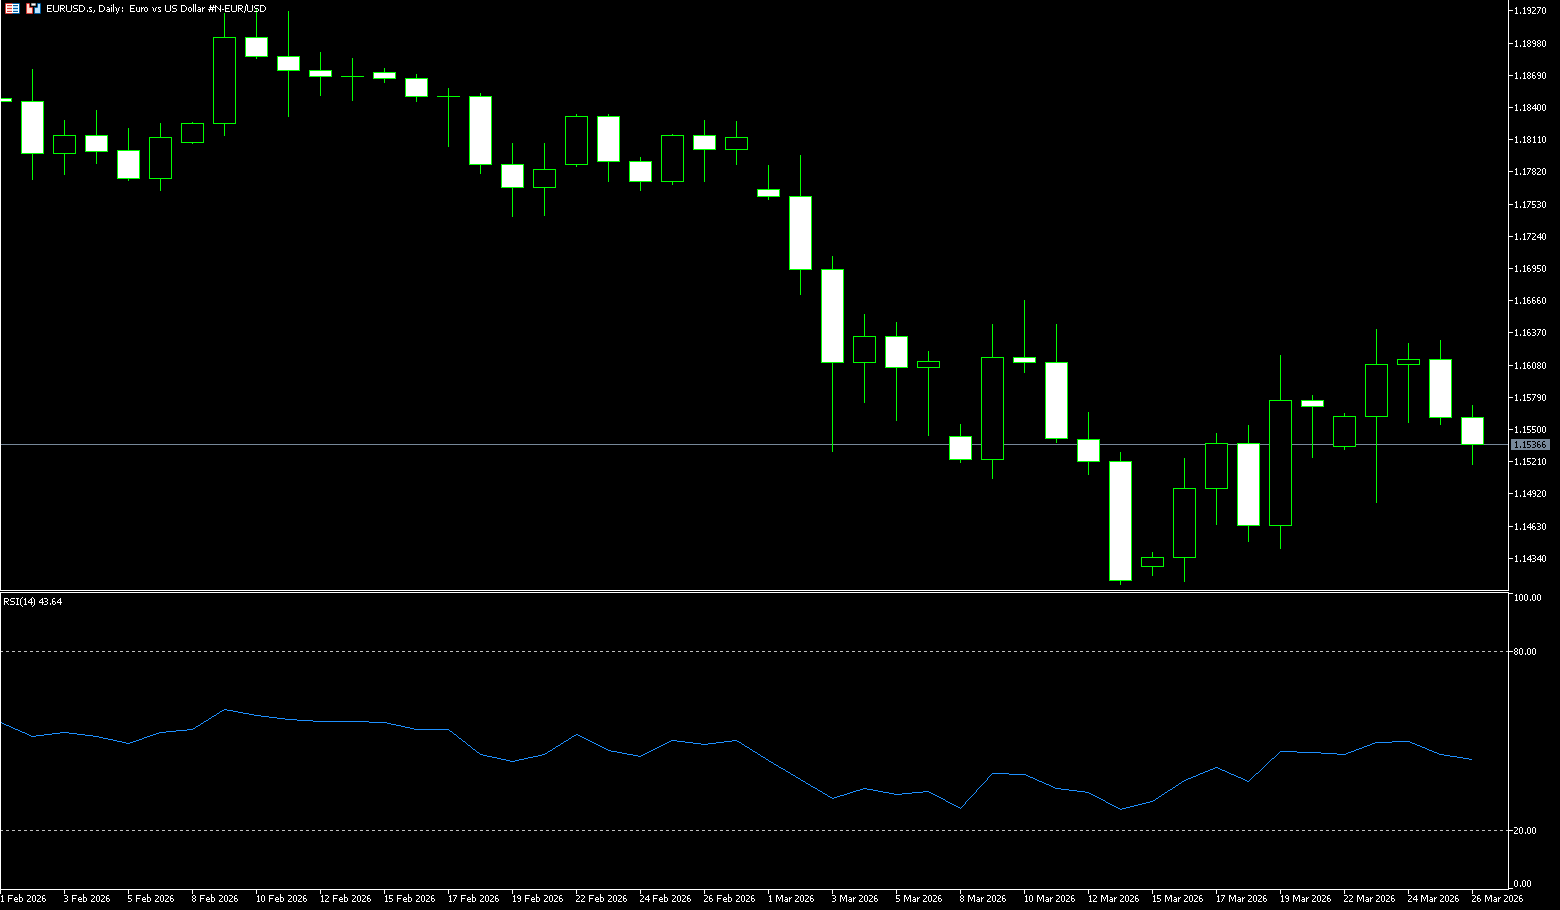
The euro/dollar pair stabilized after a slight decline the previous day, trading around 1.1540 on Thursday. The dollar remained stable amid reports that the US was actively seeking diplomatic engagement with Iran to ease the ongoing conflict, and the euro/dollar held its position. Recent reports indicate that diplomatic efforts are progressing, with discussions focusing on implementing a one-month ceasefire to create space for formal negotiations between Washington and Tehran. The Trump administration has reportedly presented Iran with a 15-point peace proposal aimed at ending hostilities in the Middle East. Some sources say the US has proposed a temporary ceasefire to facilitate dialogue, a plan reportedly conveyed through Pakistan, which is playing an increasingly important role in mediation. Senior Iranian officials are reviewing the US proposal but have indicated a reluctance to negotiate with Washington.
On the daily chart, the euro/dollar is trading at 1.1540. The currency pair continues to trade below the 55-day and 100-day simple moving averages clustered around 1.17. While the long-term trend is broadly supported, the short-term bias remains bearish. The 14-day Relative Strength Index (RSI) is at 40, below the 50 line, consistent with continued downward pressure, while the Average Directional Index (ADX) is above 34, indicating a clear trend phase rather than just sideways consolidation. Immediate resistance is at 1.1600; a break above this level would target 1.1692 (the 100-day simple moving average), coinciding with the nearby psychological level of 1.17. Initial support is at the psychological level of 1.1500, followed by 1.1469, where clustering could attract bargain hunters.
Consider going long on the Euro today at 1.1525, with a stop-loss at 1.1515 and targets at 1.1570 and 1.1580.
Disclaimer: The information contained herein (1) is proprietary to BCR and/or its content providers; (2) may not be copied or distributed; (3) is not warranted to be accurate, complete or timely; and, (4) does not constitute advice or a recommendation by BCR or its content providers in respect of the investment in financial instruments. Neither BCR or its content providers are responsible for any damages or losses arising from any use of this information. Past performance is no guarantee of future results.
Lebih Liputan


Pendedahan Risiko:Instrumen derivatif diniagakan di luar bursa dengan margin, yang bermakna ia membawa tahap risiko yang tinggi dan terdapat kemungkinan anda boleh kehilangan seluruh pelaburan anda. Produk-produk ini tidak sesuai untuk semua pelabur. Pastikan anda memahami sepenuhnya risiko dan pertimbangkan dengan teliti keadaan kewangan dan pengalaman dagangan anda sebelum berdagang. Cari nasihat kewangan bebas jika perlu sebelum membuka akaun dengan BCR.
BCR Co Pty Ltd (No. Syarikat 1975046) ialah syarikat yang diperbadankan di bawah undang-undang British Virgin Islands, dengan pejabat berdaftar di Trident Chambers, Wickham’s Cay 1, Road Town, Tortola, British Virgin Islands, dan dilesenkan serta dikawal selia oleh Suruhanjaya Perkhidmatan Kewangan British Virgin Islands di bawah Lesen No. SIBA/L/19/1122.
Open Bridge Limited (No. Syarikat 16701394) ialah syarikat yang diperbadankan di bawah Akta Syarikat 2006 dan berdaftar di England dan Wales, dengan alamat berdaftar di Kemp House, 160 City Road, London, City Road, London, England, EC1V 2NX. Entiti ini bertindak semata-mata sebagai pemproses pembayaran dan tidak menyediakan sebarang perkhidmatan perdagangan atau pelaburan.

 English
 简体中文
简体中文
 繁體中文
繁體中文
 Bahasa
Melayu
Bahasa
Melayu
 Tiếng
Việt
Tiếng
Việt
 ไทย
ไทย
 日本語
日本語
 한국어
한국어
 ភាសាខ្មែរ
 español