


0
Currency & Commodity Analysis:
US Dollar Index
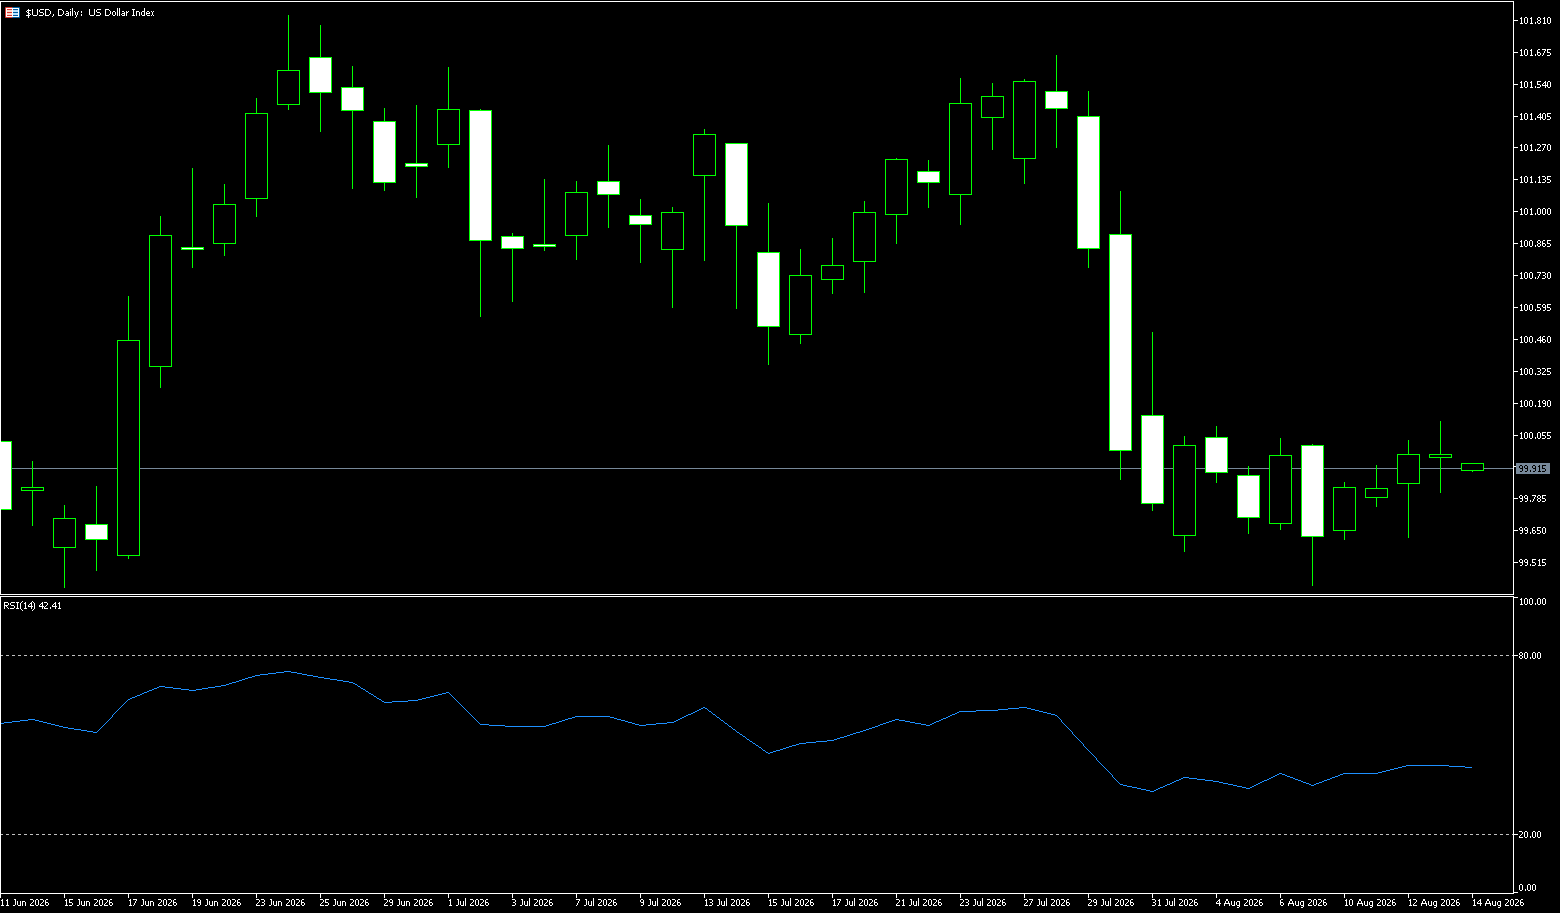
The US dollar index fell below 100 before the end of last week as weak US inflation data prompted traders to lower their expectations for a Federal Reserve rate hike in September. Inflation data released last Thursday showed that US producer prices remained unchanged in July, further confirming that price pressures did not accelerate broadly after Wednesday's modest consumer price index report. The easing of inflation reduces pressure on the Fed to raise rates in the near term. Recent data suggests that the initial inflationary impact of Middle East conflict and rising energy costs may be waning. However, uncertainty surrounding potential agreements to end the war and reopen the Strait of Hormuz continues to pose a risk to the inflation outlook.
The US labor market exhibits a unique pattern of "low hiring, low layoffs," with initial jobless claims remaining extremely low. While wage growth has shown initial signs of slowing, it has not yet established a trend. The wage-inflation transmission needs time to be verified, and the Fed is unlikely to obtain a clear reason for easing in the short term. The dollar's adjustment will be a gradual and iterative process, rather than a one-way downward trend. However, any sustained cooling of wages and inflation takes time, meaning the Fed is unlikely to obtain a clear reason for easing policy in the short term, and the dollar will remain supported during the transition period. The current situation facing the US dollar is as follows: While the cooling of inflation was confirmed in the July data, the resilience of the labor market has not yet crumbled. The slowdown in wage growth is only a "preliminary sign," far from establishing a trend. The Federal Reserve needs more data before its September meeting to verify whether inflation is continuing to decline and whether the labor market is truly softening. Before that, a significant and trend-driven weakening of the US dollar is unlikely.
Last week, the US dollar generally retreated from its highs, consolidating in a narrow range. The week saw an initial surge followed by a pullback due to inflation data, and then a period of low-level consolidation towards the end of the week. At the beginning of the week, it briefly tested the 99.50-99.55 technical support area; in the second half of the week, it briefly broke through the psychological level of 100, and is currently consolidating sideways in the 100.00-99.60 range, with bulls and bears locked in a balanced struggle. The weekly chart is likely to close with a small bearish/doji candlestick with upper and lower shadows, indicating a consolidation phase following the decline from the previous high of 101.80 (June 24th). Technical Indicators: The RSI remains around 40, in the neutral-to-weak range, not yet oversold, indicating weakening downward momentum, but no effective bullish reversal signal has yet formed; the MACD histogram is narrowing slightly, and the initial bullish divergence needs price confirmation. Key characteristics of last week's market: ① The lack of a sharp drop after negative data releases suggests buying support and geopolitical risk aversion providing bottom support; ② The rebound consistently failed to hold above the 100.00 level, indicating the short-term bearish trend advantage has not disappeared.
Currently, the market is in a typical consolidation phase awaiting a directional breakout, with volatility contracting. Next week will likely see a directional move. The market continues to trade on the September rate hike expectation while maintaining focus on Middle East geopolitical risks; the Jackson Hole event at the end of the month has already been pre-emptively priced in, making it highly susceptible to sudden price spikes due to news events. Short-term first support: 99.41 (lower edge of the trading range, last week's low); core strong support: 99.17–99.00 (200-day moving average, psychological level); extreme downside target: 98.60 (previous densely traded support); short-term first resistance: 100.00 (psychological level of the upper edge of the trading range); medium-term strong resistance: 100.50–100.45 (55-day moving average, July 31 high); and reversal confirmation resistance: 101.00 (psychological level). Meanwhile, three scenarios are projected for next week's trend—Scenario 1: Baseline scenario (highest probability, initial consolidation followed by a bottoming out and then recovery); trend path: Monday will test the 99.40 support, hold the support, and then rebound upwards to challenge the 100.00 level. Scenario 2: Bearish scenario (breakdown): A valid break below 99.40; and a 4-hour close below this level, with bears regaining control of the market. And Scenario 3: Bullish Reversal Scenario (Strong Rebound); A direct breakout above 100.00 with increased volume, breaking through the upper edge of the trading range.
Today, consider shorting the US Dollar Index at 99.75, with a stop-loss at 99.85 and targets at 99.30 and 99.20.
WTI Crude Oil
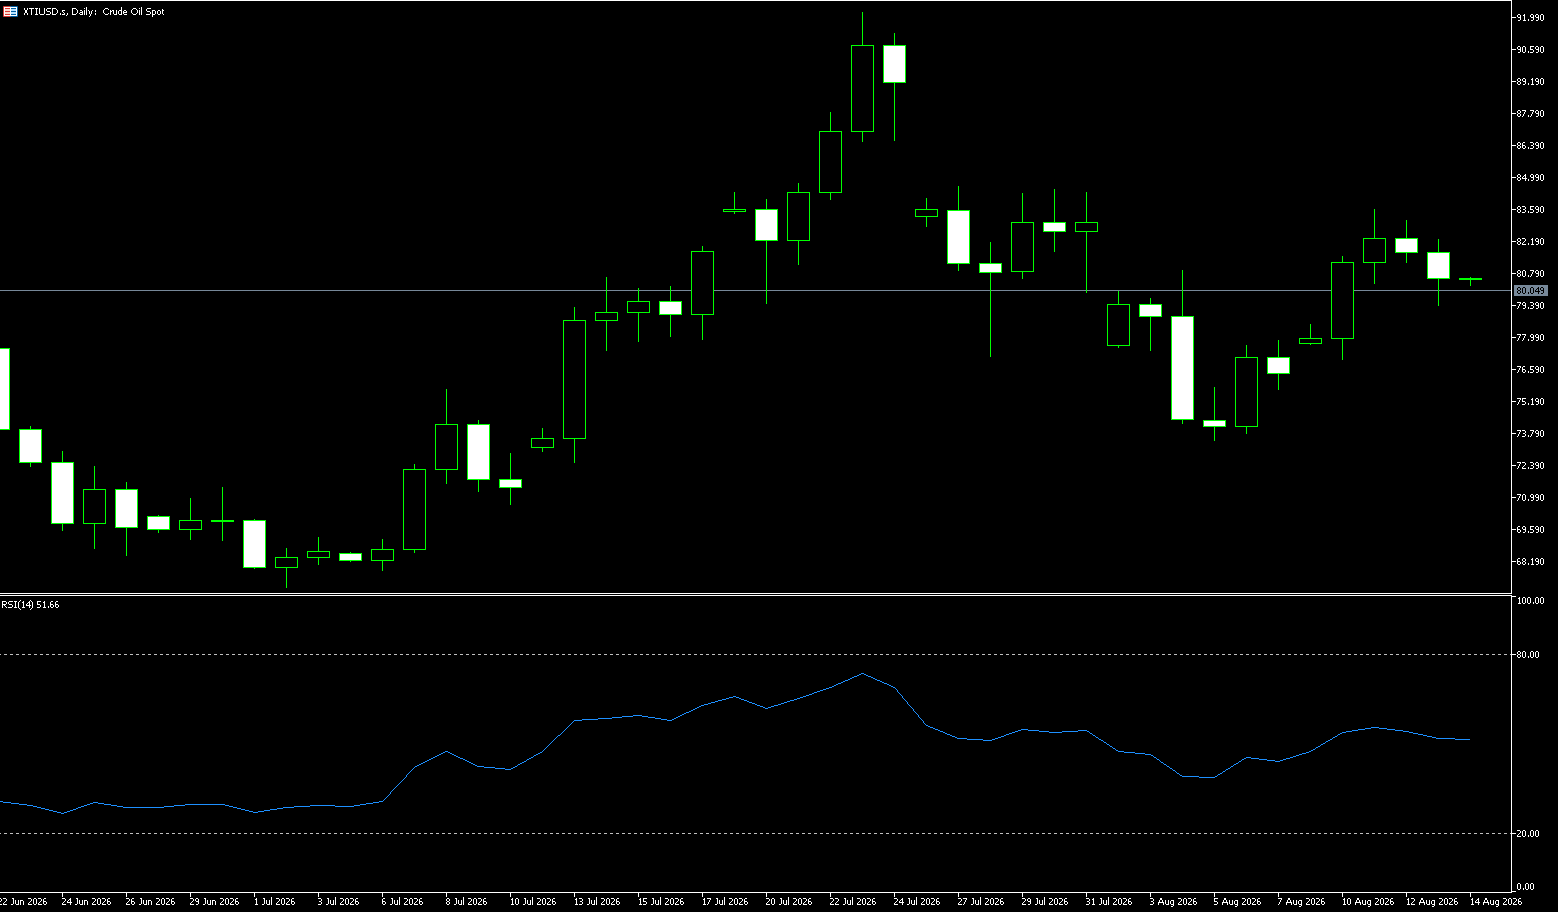
International crude oil prices rose strongly last week, with WTI crude oil surging nearly 6% for the week! The convergence of risks related to US-Iran relations and Russia-Ukraine relations in the refined oil market may lead to a situation where oil price increases slow down but refined oil prices do not decline in the near term. Although a significant increase in US crude oil inventories and downward revisions in demand forecasts by both the IEA and OPEC have exerted downward pressure on prices, the ongoing US-Iran standoff, disruptions to shipping in the Strait of Hormuz, and the supply shock to refined oil products from Ukraine's continued attacks on Russian refining facilities are multiple geopolitical risks that continue to support oil prices, offsetting short-term negative factors from the supply and demand perspective. Currently, negotiations between the US and Iran are making no progress, with no step towards a peace agreement, and the market remains concerned about the stability of Middle Eastern oil transportation routes. As a crucial choke point for global oil transportation, tanker traffic through the Strait of Hormuz is only a fraction of pre-war levels, significantly reducing the efficiency of maritime crude oil transport.
Meanwhile, the US has sent a strong signal, announcing the indefinite maintenance of the naval blockade against Iran and planning to escalate economic sanctions, further exacerbating uncertainty in the Middle East energy supply chain. Even with weak crude oil inventory data, the severe geopolitical environment has prevented a deep correction in oil prices, with geopolitical safe-haven premiums continuing to be a core support for crude oil prices. Overall, the current crude oil market is driven by geopolitical factors. Short-term fundamental headwinds such as weakening inventory and demand are unlikely to reverse the overall price strength. The Russia-Ukraine conflict has led to a qualitative shift, and domestic export controls hint at supply disruptions. Meanwhile, supply disruptions in refined oil products are forcing other refineries to operate at full capacity. This could lead to a situation where crude oil prices rise more slowly, but refined oil prices rise—meaning oil prices don't increase, but gas station prices don't decrease.
Last week, WTI crude oil experienced a surge followed by a pullback and wide-range fluctuations. The weekly chart shows a candlestick pattern with an upper shadow, closing at the mid-week low. The intraday highs gradually decreased, indicating a significant weakening of upward momentum. The rebound trend that started from $73.51 [the low on August 5th] remains intact, but last week's surge encountered resistance, creating significant pressure. Prices are still trading above the medium-term moving average, indicating a phase of adjustment within the rebound. The weekly RSI has fallen from its high, indicating cooling bullish momentum. If the price cannot regain $83.56 [last week's high] next week, the consolidation and correction will continue. From a daily momentum perspective, oil prices are currently in a consolidation phase at high levels after their previous rapid rise. Short-term momentum indicators are starting to cool, but as long as prices remain around $80 without a significant breakout, the overall structure cannot be simply defined as a shift to a bear market.
Technically, WTI crude oil prices previously broke through $80 and expanded rapidly upwards. Currently, it has retreated to levels just below $80, meaning that $80 has transformed from a psychological barrier into a short-term battleground between bulls and bears. From a medium-term perspective, oil prices have previously broken through important moving averages and the resistance of the recent downtrend, and the technical pattern has improved significantly. However, the recent continuous decline indicates that upward momentum is weakening. If the daily chart can regain a foothold around $82.50, the next potential test is $85 and $87; a decisive break above $85 could further open up further upside potential in the medium term. Conversely, if the daily chart continues to close below $78.86 (9-day moving average) and $80.00 (psychological level), then we need to be wary of this rebound entering a deeper correction, with the next support level to watch being the $76.07 (200-day moving average) area. The technical improvement formed after WTI broke through the 200-day moving average was an important foundation for this round of gains. The $83.75 (75-day moving average) level forms the first resistance zone, while the area around $86.54 (100-day moving average) is a higher-level target area.
Today, consider going long on crude oil at $81.30, with a stop loss at $81.15 and targets at $83.00 and $84.00.
Spot Gold
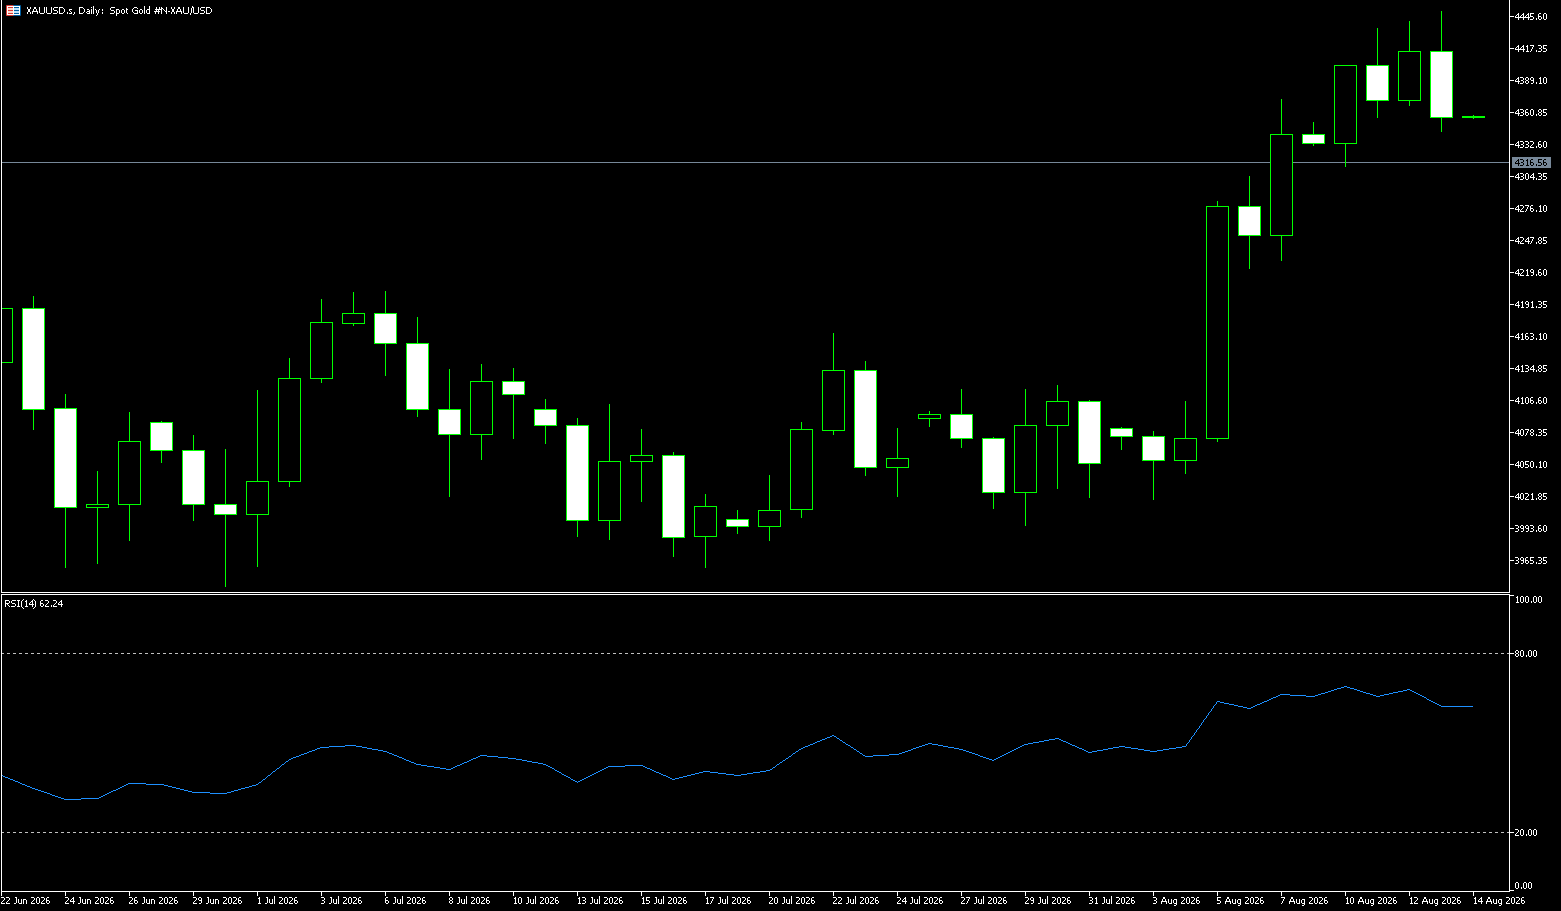
Gold prices found good support before the end of last week, falling sharply from a high of $4,450 to the $4,300 level and recovering most of the intraday losses. However, the fundamental backdrop is mixed, and caution is advised before positioning for a recovery from the recent strong rally to around $4,450, the highest level since June 5th, reached the previous day. On the other hand, the mixed fundamental backdrop last week necessitates caution before making aggressive directional bets on gold prices. Gold, however, appears to have stalled its monthly gains near the psychological level of $4,000, although downside seems limited. Traders are now awaiting US macroeconomic data—monthly retail sales and the preliminary University of Michigan consumer sentiment index—for some impetus later in the North American session.
Last week's US July PPI and CPI data were lackluster, further reducing market bets on a September Fed rate hike, thus providing support for gold based on interest rate expectations. However, profit-taking occurred after a rapid rise to around $4,450, and the safe-haven dollar continues to exert downward pressure on gold. By the close of trading at the weekend, spot gold had retreated to around $4,370, entering a short-term consolidation phase at higher levels. However, gold did not immediately launch a new round of one-sided gains despite cooling inflation, because the market had already priced in some of the positive news. Gold rose rapidly from around $4,000 to around $4,450 in a short period, and after the significant increase, some investors chose to lock in profits. The latest market data shows that gold futures closed down about 1.03% at $4,363.60 on August 13, ending a four-day winning streak; spot gold also fell significantly.
Last week, gold prices experienced a surge followed by profit-taking. At the beginning of the week, the bullish momentum continued based on expectations of interest rate cuts, reaching a high of around $4,450, a new high for this rebound. After the surge, overbought conditions were realized, and gold prices turned downwards. The adjustment continued until the end of the week, with the center of gravity shifting downwards, transitioning from a strong one-sided upward trend to a high-level consolidation structure. The weekend is likely to close with a long upper shadow bullish candlestick or a doji pattern. The weekly MA10 and MA20 are still trending upwards, and the medium-term bullish structure remains intact. The RSI, after entering a high-level range, has turned downwards, indicating a continued need for correction. The MACD histogram is shrinking, suggesting weakening bullish momentum. The weekly chart represents a period of consolidation after an uptrend, not a trend reversal. As long as last week's closing price does not decisively break below key support, the large-scale upward channel remains intact. However, technical patterns show a double-top signal at 4450, exhibiting an engulfing pattern, indicating weakening bullish momentum.
Next week's outlook: The medium-term bullish trend remains intact, and next week will likely see a period of high-level consolidation. Two possible paths exist: consolidation to form a bottom / a deep pullback to confirm support before a rebound. There are no conditions for a direct, sustained sharp decline to reverse the trend, but short-term bears have the upper hand. Key levels: Resistance (from top to bottom): First resistance: 4,387–4,400 (100-day moving average, psychological level); Second resistance: 4,450 (stage high, a key level for a bullish restart); Strong resistance: 4,500 (a psychological level for a bullish restart). Support (from top to bottom): Short-term support: 4,300, short-term support/resistance level; Core support: 4275–4285 (10-day moving average) {crucial}; Deep support: 4220–4260 range (Fibonacci support zone). Next week's trend can be categorized into two scenarios: Scenario A (stronger scenario): Rapid stabilization, ending the correction early; Opening with a firm hold above 4310 support, rebounding and stabilizing above 4360; After confirming the breakout, the bulls will attempt to retest 4400 and then the previous high of 4450. Scenario B (Risk Scenario): A decisive break below the medium-term support level (beware of black swan events); the daily chart shows consecutive closes below 4275, and the 4-hour chart continues to trade below this level; the correction range expands further, targeting around 4220, extending the medium-term upward trend and transitioning to a longer-term, wider-range consolidation.
Today, consider going long on gold at 4,372, with a stop-loss at 4,365; targets: 4,400; 4,420.
AUD/USD
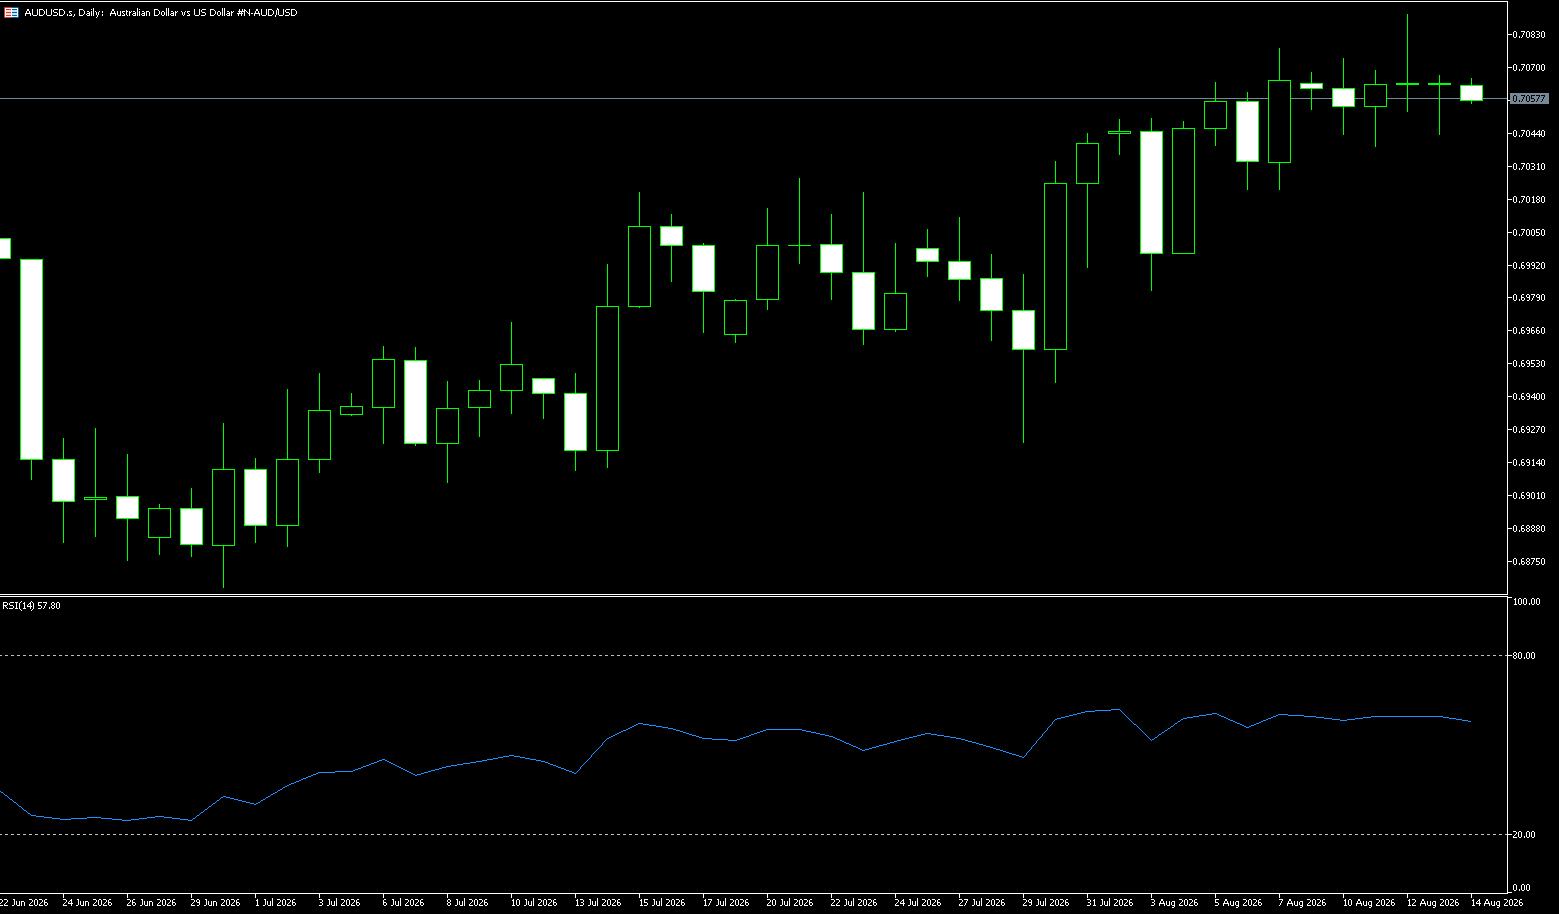
The Australian dollar rose again before the weekend as disappointing US retail sales data fueled speculation that the Federal Reserve might not raise interest rates, given initial signs of economic weakness. AUD/USD was trading at 0.7083. The Australian dollar remained above US$0.70, near multi-week highs, as recent comments from the Reserve Bank of Australia reinforced a restrictive policy stance. RBA Assistant Governor Christopher Kent stated that early rate hikes were working as expected, with tighter monetary conditions putting pressure on consumer spending and slowing overall economic activity. He pointed out that housing credit growth has slowed, new home loans have declined significantly, and overall financial conditions remain somewhat tight. This week, the central bank kept the cash rate at 4.35%, up 75 basis points since February. However, Governor Michelle Bullock stated that policymakers remain concerned that inflation may not cool as expected and are prepared to raise rates again if necessary. The market expects a roughly 54% probability of a rate hike to 4.60% by December, which could mark the end of the tightening cycle. Attention now shifts to Governor Michelle Bullock, who is scheduled to testify before Parliament on Friday.
The Reserve Bank of Australia (RBA) released hawkish signals, warning of renewed inflation risks that could trigger further rate hikes, but the market reacted mutedly, focusing more on external factors. Weaker-than-expected US July PPI data lowered the probability of a September rate hike from 40% to 34.8%, putting pressure on the US dollar and providing support for the Australian dollar. The Australian dollar is caught in a tug-of-war between bulls and bears. RBA Assistant Governor Kent said on Thursday that recent rate hikes are having the expected effects, but warned that further rate hikes remain an option should new inflation risks emerge. This statement continued the RBA's recent hawkish tone, but the Australian dollar failed to gain sustained buying support and fell for the third consecutive trading day. However, the downside for the Australian dollar may be limited at current levels. Weak US inflation data is weakening the US dollar, providing some support for the AUD/USD pair.
Last week, the AUD/USD pair generally exhibited a narrow range-bound consolidation pattern after rising from lows, representing a consolidation phase during a bullish rebound. Overall, the Australian dollar is currently caught in a tug-of-war between bullish and bearish forces. The short-term trend of the Australian dollar faces a tug-of-war between internal and external drivers: domestically, the effects of the RBA's interest rate hike are becoming apparent in the real economy, with a slowdown in the housing market and cooling demand weakening the fundamental support for the Australian dollar; externally, cooling US inflation is putting pressure on the US dollar, providing bottom support for the Australian dollar. Since rebounding from the previous low, the price has stabilized above the weekly short-term moving average; the RSI has continued to rise without entering overbought territory, maintaining a healthy medium-term rebound structure. The primary weekly resistance is concentrated at the 0.7100 level. Last week's summary: The overall bullish structure remains dominant, but the short-term upward movement has encountered a clear ceiling; a sustained move above 0.709 (last week's high) - 0.7100 (psychological level) would indicate a continuation of the rebound trend; continued pressure below 0.7100 suggests a likely period of consolidation.
Next week's technical outlook: The market is consolidating, awaiting a directional move. Key levels to watch are the resistance at 0.7090 (last week's high) - 0.7100 (psychological level) and the support at 0.7012 (25-day moving average) - 0.7000 (psychological level). The AUD/USD pair is currently consolidating around 0.7080, but maintains a constructive bullish bias as it remains within an ascending parallel channel. The pair is trading above the 25-day moving average at 0.7012, indicating continued underlying demand, while the upper channel line near 0.7077 limits immediate upside potential. On the downside, initial support lies at 0.7012 (25-day moving average) - 0.7000 (psychological level), with the lower edge of the ascending channel at approximately 0.6951. Deeper structural support is near 0.6937 (200-day moving average). On the upside, a sustained break above the channel resistance at 0.7077 would open up further upside potential within a broader ascending structure. A move above 0.7090 (last week's high) - 0.7100 (psychological level) presents key resistance levels at the June 5th high of 0.7144 and the psychological level of 0.7200.
Consider going long on the Australian dollar at 0.7070 today, with a stop-loss at 0.7060 and targets at 0.7130 and 0.7140.
GBP/USD
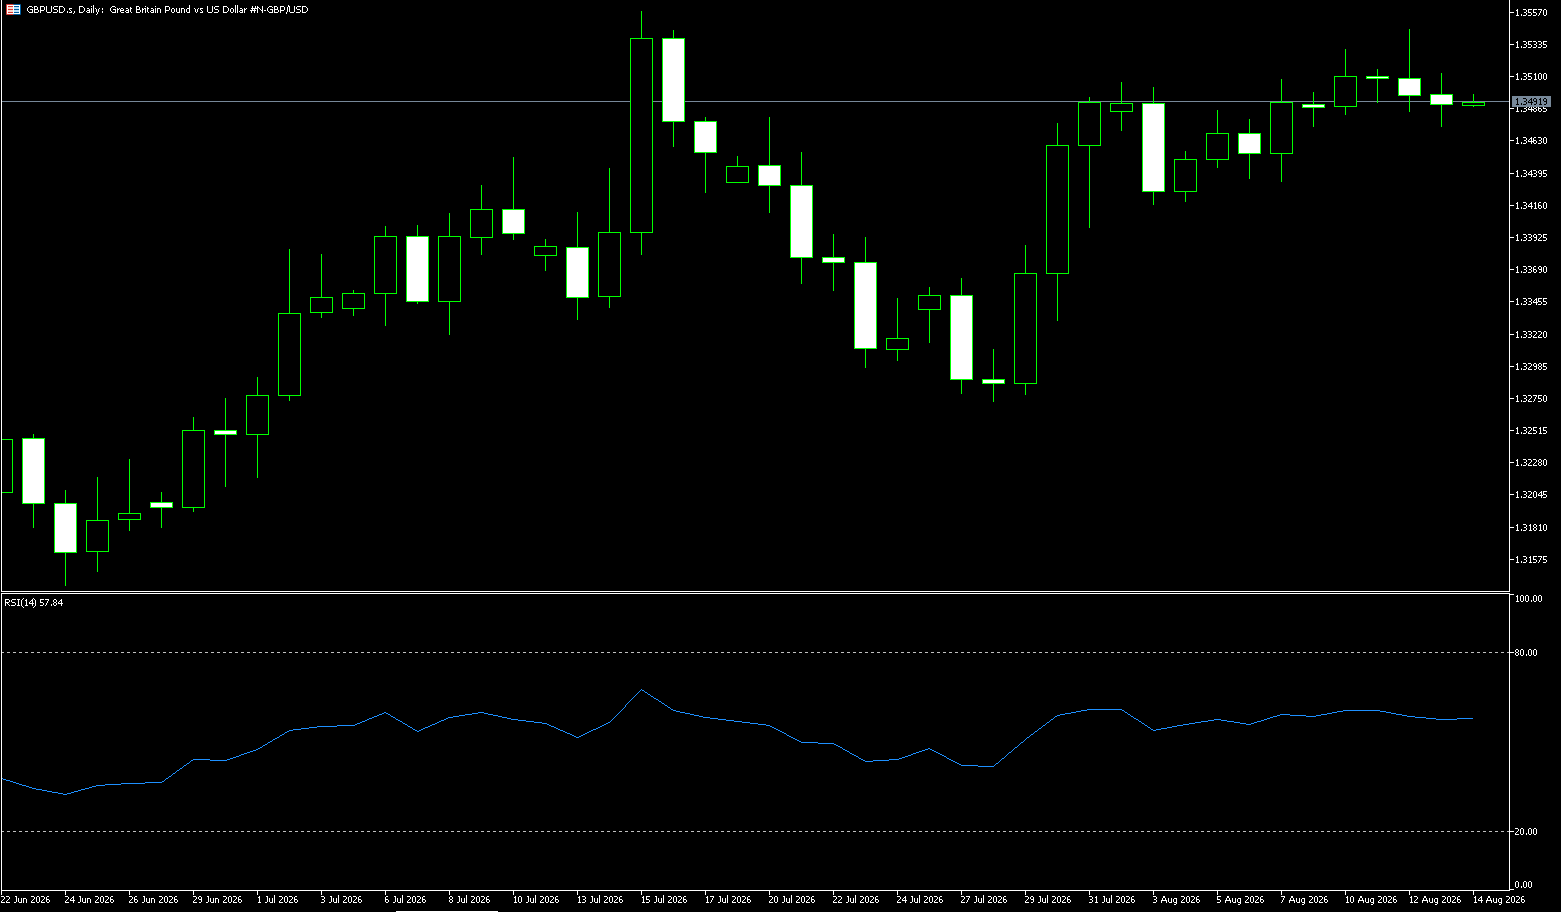
The pound regained momentum against the dollar over the weekend, rising to a 13-week high near the 1.3560 area. The pound's sharp rise against the dollar came after three consecutive days of decline, continuing the escalating selling pressure that was weighing on the dollar. Investors were weighing strong UK economic data against ongoing geopolitical uncertainty in the Middle East. UK GDP grew 0.4% quarter-on-quarter in the second quarter, in line with economists' expectations. However, household consumption growth slowed to 0.2%, highlighting continued pressure on consumers. Meanwhile, negotiations aimed at ending the US-Iran conflict and reopening the Strait of Hormuz remained stalled, and shipping disruptions and attacks continued to impact market sentiment. The Bank of England kept interest rates unchanged in July, with Governor Andrew Bailey stating that the de-inflation process remained on track despite persistent external risks.
The dollar's downside remains supported by safe-haven demand. The continued high volatility in the Middle East, along with uncertainties surrounding energy supplies and key shipping routes, kept global risk premiums high. The dollar retains its appeal as a traditional safe-haven asset when market concerns about further risk events escalate, meaning that even if US interest rate expectations decline, the dollar may not experience a sustained one-sided decline. A key contradiction currently facing the UK economy is the coexistence of resilient growth and renewed inflationary pressures. Rising energy costs could continue to push up business operating costs and residential living costs, and if energy prices remain high, there is a risk of renewed inflation in the UK in the coming months. This will present the Bank of England with a more complex policy trade-off between cutting interest rates and controlling inflation, and limit market bets on further weakness in the pound.
Last week, the pound traded in a range-bound manner against the dollar, with bulls attempting to break through key resistance but failing, representing a consolidation phase after the recent rise. The exchange rate held above the 50-week moving average, maintaining a healthy medium-term uptrend structure; the RSI remained neutral to bullish and had not yet entered overbought territory; the immediate resistance level is 1.3550–1.3570. This week's closing price is likely to be a small bullish candle or a doji, indicating consolidation within an uptrend without a trend reversal signal. Technically, short-term momentum is currently in a recovery phase, but not yet sufficient to confirm a trend breakout. The RSI remains in the 60–65 range, indicating bullish momentum, but this momentum is weakening and lacks incremental funds for a breakout; the chart pattern shows a rising wedge/range consolidation, awaiting a directional move.
The expected trading range for GBP/USD next week is 1.3400 (psychological level) – 1.3637 (May 8 high), with a focus on consolidation awaiting a breakout. The weekly bullish structure remains intact; avoid prematurely predicting a trend reversal, and view pullbacks primarily as adjustments within an uptrend. On the daily chart, GBP/USD remains above the 20-day moving average at 1.3427 and the 100-day simple moving average at 1.3413, both reinforcing the short-term bullish bias. The price is also approaching last week's high resistance at 1.3546. This suggests that pullbacks may attract buying, while the broader uptrend remains intact. On the downside, near-term support is seen near the 20-day simple moving average at 1.3427, followed by the psychological level of 1.3400. If the correction widens further, the 30th of last month at 1.3333 will serve as deeper structural support. On the upside, the July 15 high of 1.3558 is the next resistance level to watch. A sustained break above this level would open up further upside potential to 1.3600 (a psychological level) and 1.3637 (the May 8 high). However, failure to break through this barrier suggests the pound/dollar pair is likely to consolidate above its current moving average support.
Consider going long on the pound today at 1.3525, with a stop-loss at 1.3515 and targets at 1.3570 and 1.3580.
USD/JPY
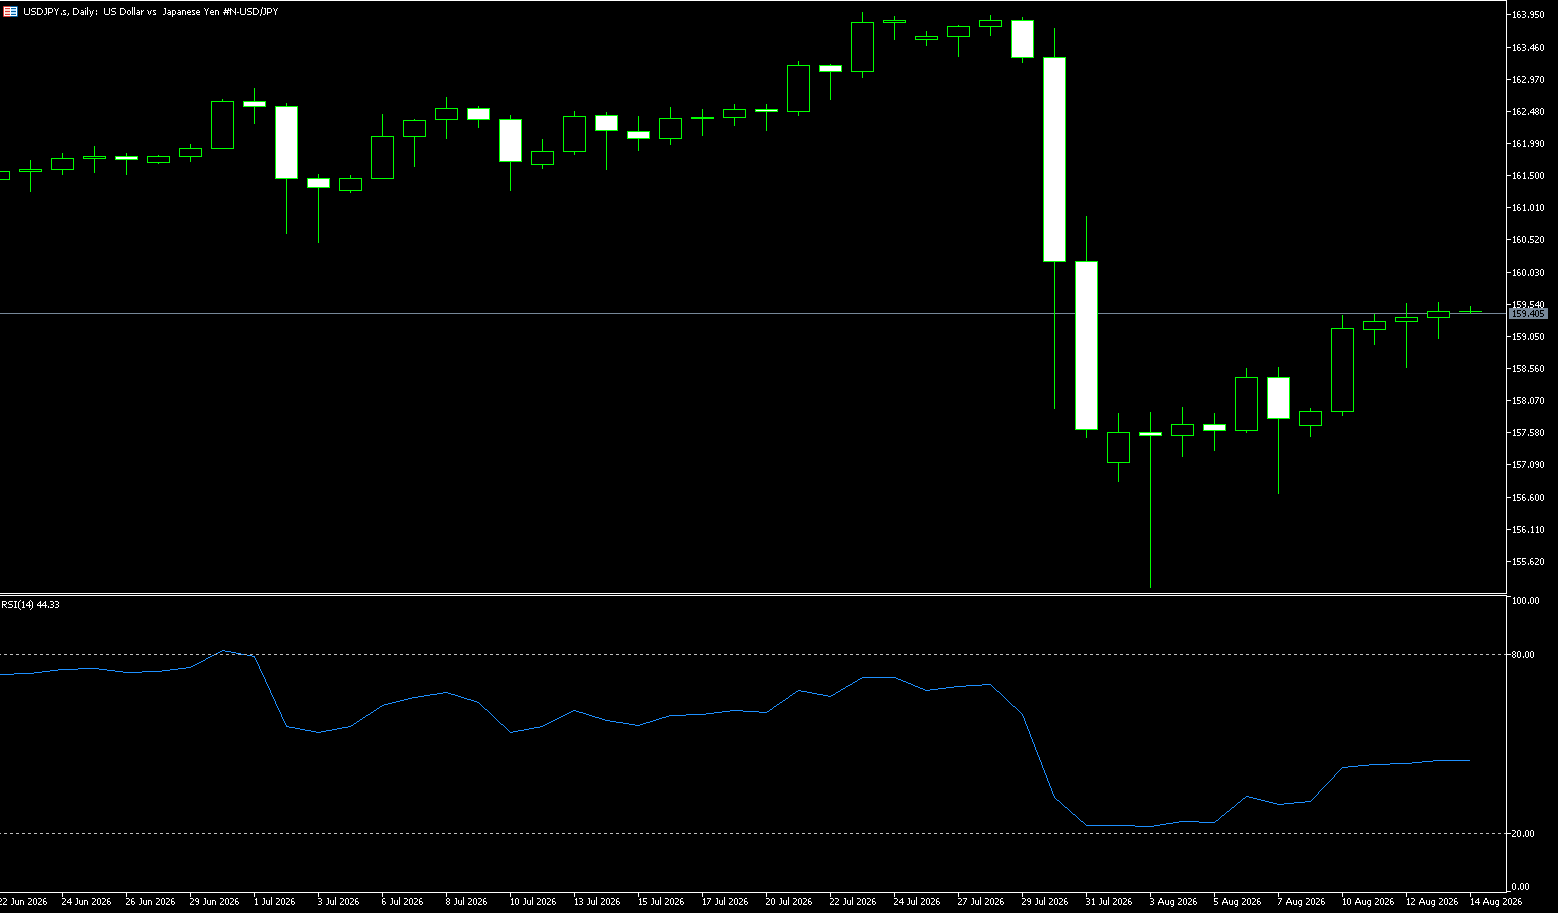
The yen fell to a low near 159.30 per dollar in late last week's trading and is expected to decline by about 1% this week as a lack of follow-through intervention from authorities encourages speculators to continue shorting the currency. The yen has now retraced about half of its gains from late July and early August, when record-breaking joint interventions by Tokyo and Washington occurred. The currency remains under pressure from long-term fundamentals, including wide interest rate differentials, heightened fiscal concerns, and high energy and import costs. Meanwhile, markets are speculating that the Bank of Japan may raise interest rates in September or October, fearing that a weaker yen will drive inflation. US Treasury Secretary Scott Bessant has also stated that Japan should strengthen its monetary intervention through policies and economic fundamentals that support the yen.
Earlier this month, the US and Japan jointly launched the largest yen-buying operation in history (approximately 8.45 trillion yen in the first round), pushing the yen up by nearly 9 yen in two days, but giving back half of those gains within seven trading days. Despite weak US PPI and unemployment data, and the probability of a Fed rate hike in September falling to 34.8%, Japan's real interest rate remains deeply negative, with carry trades and energy import costs continuing to put pressure on the yen. The Japanese Ministry of Finance will announce the total monthly intervention amount at the end of August, at which time the market will assess the effectiveness of this expenditure against the current exchange rate (closer to the start rather than the end of the intervention). Notably, Japan has explicitly stated that it will finance future interventions through the Federal Reserve's foreign monetary authority repurchase facility, rather than selling US Treasury bonds, removing the previous upper limit on the scale of intervention. However, the fact that "money is no object" makes the current situation of giving back half of the gains even more awkward—the intervention did not change the trend, but only temporarily suppressed volatility.
Last week's opening saw a sharp jump, followed by four days of high-level narrow-range consolidation, with the center of gravity continuously rising and approaching the psychological level of 160. The rebound after the joint intervention in early August, which brought the price down to around 155.23, continued, but the pace of the rise slowed, shifting from a one-sided rebound to a consolidation phase. For traders, this means that the yen's narrative has shifted from "defending a certain price level" to "tracking the tightening cycle"—the latter being a more sustainable and tradable logic. Last week's weekly candlestick likely closed with a bullish candle with an upper shadow, indicating a recovery from the low of 155; the price is above the short-term weekly moving average, but is very close to the medium-term resistance zone (160.60–161.00). The medium-term downtrend has temporarily slowed, entering a recovery and rebound phase, but with dense resistance above, there is no condition for a sustained, mindless surge. The RSI technical indicator has rebounded from a low level to a neutral-to-bullish zone, but has not yet entered a severely overbought state; the MACD histogram continues to contract, indicating a continued decline in bearish momentum, but a valid golden cross has not yet formed.
From a daily chart perspective, USD/JPY is currently in a consolidation phase after the recent high of 159.60. The exchange rate is trading below the 100-day moving average at 159.99 and the psychological level of 160.00, indicating that it is still under pressure from the moving averages in the short term. Currently, 160.00 has become the most sensitive policy and psychological level for USD/JPY. The first resistance level to watch is the 159.99-160.00 area. If the price can effectively break through and hold above 160.00, and further break through 161.12 (the 50-day moving average), it would mean that the short-term bearish pressure has eased, and the price may retest the 162.00 level (the psychological level). On the downside, 158.88 (the 150-day moving average) is the first short-term support level. If the exchange rate breaks below this level, it may further decline towards 158.22 (the 200-day moving average) or even the 158.00 level in the short term. Particular attention should be paid to whether an accelerated decline occurs after the 158.00-158.22 level is breached, as the yen could appreciate rapidly if market expectations of Japanese policy intervention or intervention risks are amplified again.
Today, consider shorting the US dollar at 159.50, with a stop-loss at 159.70 and targets at 158.50 and 158.60.
EUR/USD
The euro traded around $1.15 in August, near a two-month high, as traders grappled with conflicting signals from the Middle East situation and the prospects for a US-Iran agreement, while also assessing rising oil prices and their impact on inflation. In Europe, market-based inflation expectations, reflected in eurozone swaps over the next year, were around 2.4%, above the ECB's 2% target. Meanwhile, the eurozone's economic outlook improved, with recent resilience prompting analysts to become more optimistic about growth. At the same time, the euro consolidated within a narrow sideways range for most of August, lacking a clear catalyst since the FOMC meeting at the end of July. This observation confirms the current lack of directional drivers in the market—there is neither sufficient reason to push the euro upward nor enough momentum for a significant decline.
US July CPI and PPI data met expectations, with year-on-year growth slowing for the second consecutive month. Market expectations for a Fed rate hike in September further decreased to 40%, theoretically putting pressure on the dollar. However, escalating geopolitical tensions in the Middle East provided safe-haven buying support for the dollar, offsetting the negative impact of the inflation data. The euro/dollar exchange rate is expected to continue its narrow range trading. Despite moderate inflation data that was supportive of the euro, the dollar did not weaken significantly, mainly due to ongoing geopolitical tensions in the Middle East providing support for safe-haven currencies. The US and Iran remain deadlocked in negotiations to permanently end the Gulf War. Continued uncertainty surrounding the Strait of Hormuz, coupled with political confrontation between the US and Iran, has dampened global risk appetite. As the world's primary safe-haven currency, the dollar has thus received buying support, limiting the euro's upside potential against the dollar.
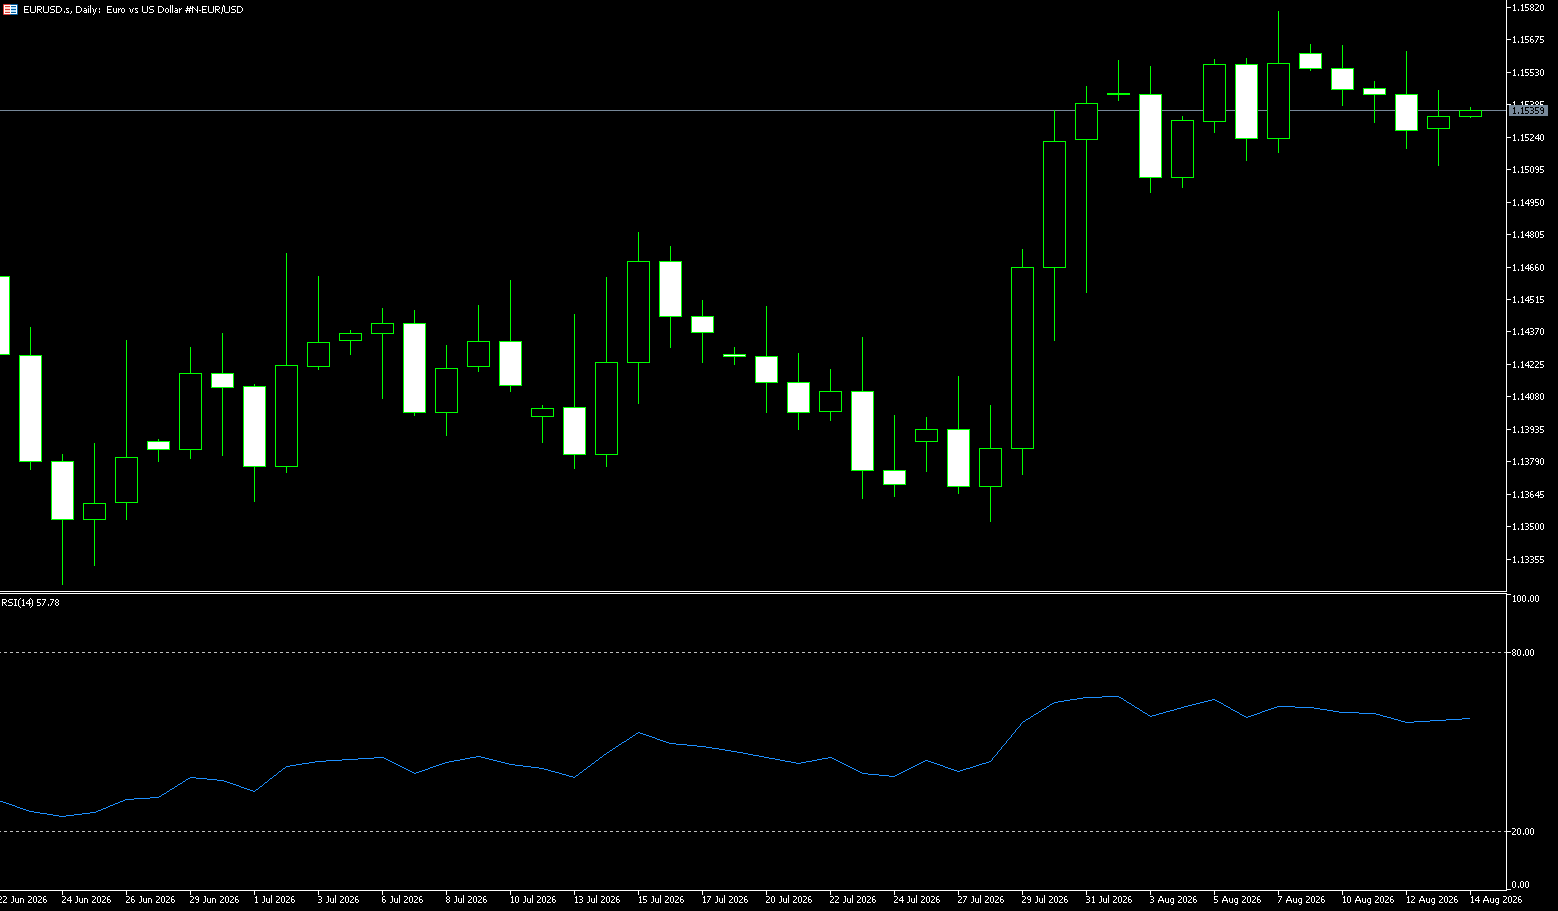
Last week, the euro/dollar maintained a high-level range-bound trading pattern, continuing the rebound from the June low of 1.1324, but bullish momentum clearly weakened. Opening at 1.1542, it rose to 1.1565 before encountering resistance, subsequently falling back to a low of 1.1510. Throughout the week, it remained trapped within the 1.1500–1.1567 range, failing to break upwards. The medium-term rebound trend remains intact: prices are trading steadily above the 50-day moving average (1.1465), and the upward structure of this rally remains unbroken; multiple failed tests of key resistance levels (1.1567–1.1570, 100-day moving average + previous supply zone) have formed a short-term "double top resistance"; the MACD indicator remains above the zero line, but the red bars are continuously narrowing, indicating weakening bullish momentum; while the RSI has fallen from near 65 to around 53, moving out of the bullish zone and into neutral oscillation.
Next week, the focus remains on range-bound trading, with three possible paths: Scenario A (higher probability): continued consolidation awaiting data catalysts; Scenario B (bullish): a decisive break above the upper trendline, initiating a new round of upward movement; Scenario C (bearish): a break below key support, triggering a deep pullback. Meanwhile, observing the daily chart, the exchange rate previously rebounded rapidly from around 1.1352 to 1.1581 (August 7th high) and has since moved back above 1.1477 (55-day simple moving average). The current price is between 1.1581 and 1.1500, but the recent price action has been noticeably shorter, indicating that after the previous rapid price correction, short-term fluctuations are entering a rebalancing phase. First resistance: 1.1567–1.1570 (a level that has faced resistance multiple times this week; only a daily closing price above 1.1570 confirms a breakout); Second resistance: 1.1600–1.1630 (psychological level + 200-day simple moving average); First support: 1.1510–1.1500 (this week's low + psychological level, bullish support); Second support: 1.1465–1.1470 (50-day simple moving average, medium-term trendline).
Consider going long on the Euro today at 1.1545, with a stop-loss at 1.1535 and targets at 1.1580 and 1.1590.
Stock Analysis:
Australian ASX 200 Stock Index
Basic Market Overview:
The Australian Securities Exchange (ASX) 200 index fell 73 points, or 0.8%, to close at 9,115 on Friday, marking its third consecutive decline and its lowest close in over a week. Market sentiment weakened as US futures fell due to President Trump's new tariffs on drone imports, with analysts pointing to China as the primary target. Meanwhile, US Treasury Secretary Bessant warned on Thursday of unprecedented measures against Iran, promising that "economic isolation would be unprecedented." Locally, Australian housing loan growth fell to a third-quarter low in the second quarter, although the rate of decline slowed. Focus now shifts to July's employment data, due next week, after the unemployment rate remained stable in June.
Transportation, industrials, healthcare, and non-energy mining sectors were hit hard. BHP Billiton and Rio Tinto fell 3.4% and 2.9% respectively, while three of the four major banks also saw pullbacks. Gold mining performed poorly, with Evolution Mining falling 4.0% and Northern Star down 3.2%. The market fell 1.6% this week, erasing the gains of the previous three weeks.
Sector Performance:
Sectors likely to lead the market next week (in order of priority):
1. Information Technology (XIJ)
• Logic: Nasdaq continues to hit new highs, global AI sentiment is spilling over; Australian tech stocks have undergone significant corrections, presenting opportunities for high-low rotation and oversold recovery; the sector has low weighting, requiring minimal capital to drive growth.
• Representative Stocks: Afterpay's parent company Block, Computershare, Altium
• Risk: A pullback in US tech stocks from their highs could directly drag down the sector's rebound sustainability.
2. Consumer Staples (XSJ, Defensive Sector)
• Logic: In a high-interest-rate environment, funds favor defensive attributes; supermarkets have stable cash flow and dividends; earnings reports are being released, attracting continued safe-haven investment.
• Representative Stocks: Woolworths, Coles
• Characteristics: Moderate upward slope, unlikely to experience explosive growth, mainly characterized by slow and volatile increases.
3. Energy Sector (XEJ)
• Logic: International crude oil prices remain relatively strong; geopolitical uncertainties persist, supporting profit expectations for oil and gas companies.
• Representatives: Woodside Energy, Santos
• Constraints: If the Middle East conflict eases significantly, the sector will face short-term pressure.
Highly likely to lead the decline/underperform the broader market next week.
1. Raw Materials/Mining (XMJ)
• Core Pressures: Iron ore prices remain weak; demand expectations for Chinese real estate and steel are sluggish; the sector has already seen consecutive corrections this week; previous gains were substantial, leading to significant profit-taking pressure. Copper and lithium prices lack upward catalysts.
• Key Weighting Companies: BHP, Rio Tinto, FMG. This sector accounts for nearly 25% of the ASX200 and will directly drag down the index.
• Only Variable to Trigger a Rebound: A sharp short-term surge in iron ore prices or the introduction of strong domestic stimulus policies.
2. Real Estate REITs (XPJ)
• Logic: The market continues to postpone expectations of a Reserve Bank of Australia (RBA) rate cut; persistently high interest rates are suppressing real estate valuations; commercial real estate faces pressure from vacancy rates and high financing costs, resulting in generally weak financial reports.
• Overall Tendency: Likely to continue underperforming the market next week.
3. Consumer Discretionary Products (XDJ)
• Logic: High inflation and high interest rates are squeezing consumer discretionary spending; weak earnings expectations for the tourism, retail, and automotive sectors, and no improvement in consumer confidence.
• Representatives: Chain retailers, gaming, and car dealerships.
Technical Analysis:
The ASX200 opened at 9232.6 last week, but lacked upward momentum, declining for three consecutive days and closing with three consecutive negative days. It has been retreating from its recent high of 9296.7 (an all-time high), with a maximum weekly fluctuation of approximately 2%. Significant divergence emerged in external markets: US technology stocks continued to reach new highs, but Australian resource stocks weakened independently, dragging down the overall market, creating a pattern of external strength and internal weakness. Technical Analysis for Next Week: The index has entered a phase of high-level correction and consolidation from its historical high. The short-term RSI has fallen from overbought to neutral territory, but has not yet entered deep oversold territory, indicating that the correction space is not completely closed. The ASX200 has broken below the short-term 5-day moving average, turning it into resistance. The overall pattern is: weak consolidation at high levels, with a tendency to test support levels. A short-term technical rebound cannot be ruled out, but its sustainability is questionable.
Three Scenario Probability for Next Week: Baseline Scenario (Highest Probability) – A slight rebound to 9180-9200 followed by a pullback, repeatedly testing the 9090 support level; if the support holds, a wide range of consolidation between 9090 and 9200 will occur. Optimistic Scenario – A rapid stabilization above 9200, retesting the previous high of 9296, requires a recovery in iron ore prices and a significant improvement in risk appetite in the Asia-Pacific region. Pessimistic Scenario — A decisive break below 9090 and a close below it would further test the key support level of 9020; once 9020 is breached, the medium-term uptrend structure would be destroyed.
Trading Strategy:
Next Week's Trading Strategy (Short-Term Swing Trading Perspective)
Overall Strategy
Currently in a pullback window after a new high, the priority is to observe and avoid aggressively chasing the market higher; strict stop-loss orders should be set for both shorting on rallies and buying on dips, and positions should be lightly traded.
ASX200 resource stocks have extremely high weighting; the movements of iron ore and the Australian dollar will greatly influence the market.
1) Long Position Strategy (Consider only in support zones)
• Entry Range: 9095–9110, stabilization at support and the appearance of a bottoming candlestick pattern.
• Target: 9180 → 9200
• Stop-Loss: Exit if the price breaks below 9080.
Note: This is a long position on a rebound; it is not advisable to have too long a horizon and is not suitable for long-term heavy positions.
2) Short Selling Strategy (Priority Strategy)
• Entry Range: Rebound to 9180-9200, encountering resistance and stalling.
• Target: 9100, break below to 9020.
• Stop Loss: Exit above 9210.
3) Alternative Strategy for Consolidation:
If the index continues to fluctuate between 9090 and 9190, minimize frequent short-term trading; wait for a breakout from the range and follow the trend to avoid being stopped out repeatedly.
Key Risk Warnings:
Chinese Demand Expectations and Iron Ore Prices: Continued decline in iron ore prices will continue to suppress heavyweight stocks like BHP/RIO, dragging down the index.
Federal Reserve Interest Rate Expectations Fluctuations: US Treasury yields and dollar fluctuations will transmit to the Australian dollar, indirectly affecting resource company profits.
Geopolitical Risks: The situation in the Middle East disrupts commodities and global risk sentiment.
US Stock Market Volatility: If US tech stocks experience a significant correction, global risk appetite will decline, making it difficult for Australian stocks to strengthen independently.
Dow Jones Industrial Average
Basic Market Overview:
Last week, U.S. stocks retreated slightly after hitting record highs, but the S&P 500 still recorded its third consecutive weekly gain. Investors continued to digest the positive impact of this week's moderate inflation data, while also beginning to reassess the risks of slowing U.S. consumption, employment, and economic growth. The S&P 500 fell 0.2% on Friday, closing at 7785.76; the Nasdaq Composite fell 0.3% to 26729.16; and the Dow Jones Industrial Average fell 107.58 points, or 0.2%, to close at 53732.41. On a weekly basis, the S&P 500 rose 0.4%, marking its third consecutive weekly gain; the Nasdaq also rose for the third consecutive week, gaining slightly by 0.1%; while the Dow fell a cumulative 0.6%.
Last week was a milestone for U.S. stocks. The S&P 500 broke through 7800 points for the first time on Thursday, reaching a record high of 7816.70 points and closing at a record high of 7798.99 points. US stocks rose continuously after relatively mild US inflation data released on Wednesday and Thursday. Friday's market pullback reflected investors entering a "digestion period" as the earnings season neared its end, a similar trend likely to continue throughout the remainder of August and into September. As corporate earnings catalysts gradually diminish, the market may shift from a rapid upward phase to sideways consolidation. If corporate profit growth can maintain its current level, the Strait of Hormuz remains closed keeping oil prices above $80 per barrel, and the Federal Reserve keeps interest rates unchanged, the S&P 500 could rise to 8100 points by the end of the year.
Sector Performance:
Leading Sectors
Next Week's Forecast [Potential Leading Sectors + Core Constituent Stocks]
1. Financial Sector (Highest Weighting in the Dow Jones Industrial Average, 27.3%)
Core Stocks: JPMorgan Chase (JPM), Goldman Sachs (GS), American Express (AXP), Visa (V), Travelers Insurance (TRV)
Driving Logic:
1) If the Fed minutes release a dovish signal and short-term rate hike expectations cool, long-term US Treasury yields will stabilize and decline, benefiting bank net interest margin expectations;
2) In a volatile market environment, leading investment banks are valued at relatively low levels; Goldman Sachs' high valuation has a strong pull on the Dow Jones Industrial Average.
Triggering Conditions for Strengthening: Inflation expectations do not rebound, and oil prices no longer surge significantly.
2. Consumer Staples (Defensive Sector)
Core Stocks: Walmart (WMT), Procter & Gamble (PG), Coca-Cola (KO)
Driving Logic: High-level market risk aversion and rotation of funds; Walmart's consumer data shows resilience as the retail earnings season nears its end; possesses resilience and rebound potential during index corrections.
3. Healthcare Sector
Core Stocks: UnitedHealth Group (UNH), Johnson & Johnson (JNJ), Merck (MRK), Amgen (AMGN)
Driving Logic: UNH is the most expensive component stock in the Dow Jones Industrial Average, and its fluctuations significantly impact the index; healthcare is a defensive sector, attracting funds to hedge in an uncertain environment; pharmaceutical companies continue to provide catalysts through their pipelines.
Leading Declining Sectors
Predicted Sectors for Next Week [Potential Leading Declining Sectors + Core Constituent Stocks]
1. Information Technology (Technology Blue Chips)
Core Stocks: Apple (AAPL), Microsoft (MSFT), Cisco (CSCO), IBM
Risks: High valuations, extremely sensitive to US Treasury yields; if the FOMC minutes are hawkish and interest rate hike expectations rise, high-valuation technology blue chips will face pressure; concerns about AI capital expenditure returns continue to suppress sentiment.
2. Industrial Sector
Core Stocks: Caterpillar (CAT), Honeywell (HON), Boeing (BA), 3M (MMM)
Risks: Weak global manufacturing PMI expectations; commodity volatility suppressing heavy industry profit expectations; Boeing continues to be affected by news regarding aircraft deliveries and geopolitical supply chains.
3. Energy (Chevron CVX Only)
Risks: Oil prices become a key variable; if the Middle East situation eases and crude oil continues to decline, CVX will weaken along with oil prices; the Dow Jones only has one energy stock, making it prone to underperforming the market during periods of declining oil prices.
Technical Analysis:
The market opened at 53975.98 last week, with an intraday high of 54222.85 and a low of 53622.46 this week. This ended a two-week winning streak, following a record high of 54349.12 earlier this month, followed by a period of consolidation and pullback. Friday's closing price was 53732.41, resulting in a weekly decline of 0.56% (-304.52 points). Over five trading days, there were four declines and one rise, maintaining an overall pattern of high-level narrow-range consolidation and gradually weakening bullish momentum, with the trading range continuing to narrow. The index remains firmly above the 20-day moving average (≈52990), and the medium-to-long-term upward trend remains intact. The 14-day RSI has fallen from a high to the neutral zone, moving away from overbought territory but not yet into oversold territory. The candlestick closed as a small bearish candle, a normal pullback after reaching a new high, not a trend reversal signal. The overall pattern is high-level sideways consolidation, awaiting a breakout.
Two Scenario Analysis (Technical Path for Next Week)
Scenario 1: Neutral to Bullish (Baseline Scenario, Highest Probability)
Price stabilizes with support at 53620, testing 53980.
• Conditions: No significant break below 53620; dovish Fed meeting minutes.
• Target: Initially targeting 54200; a breakout with volume could lead to a move above the historical high of 54350.
Scenario 2: Oscillating Downward (Bearish Scenario)
Price repeatedly tests and fails to hold the 53620 support level during the day.
• Conditions: Hawkish Fed meeting minutes; rebound in US Treasury yields.
• Downside Target: 53340 → Key Support at 53000; a breach of 53000 on the weekly chart would prolong the medium-term correction period.
Trading Strategy:
Bull Strategy
Consider buying if the price retraces to the 53620-53680 range and stabilizes; stop-loss below 53580.
First target: 53950, hold if it breaks through and target 54200.
Bear Strategy
Consider selling if the price rebounds to around 53950 and encounters resistance, failing to break through; stop-loss above 54020.
First target: 53650, break below and target 53350.
Key Risk Warnings:
US stocks are highly susceptible to gaps due to overnight news, Fed comments, and geopolitical conflicts, which can instantly invalidate technical structures.
The Dow Jones is a price-weighted index; sharp fluctuations in a few heavyweight stocks can distort the index's movement.
Historical technical patterns only represent probabilities and cannot predict black swan events. Please manage your funds and set stop-loss orders accordingly.
Disclaimer: The information contained herein (1) is proprietary to BCR and/or its content providers; (2) may not be copied or distributed; (3) is not warranted to be accurate, complete or timely; and, (4) does not constitute advice or a recommendation by BCR or its content providers in respect of the investment in financial instruments. Neither BCR or its content providers are responsible for any damages or losses arising from any use of this information. Past performance is no guarantee of future results.
Lebih Liputan






Pendedahan Risiko:Instrumen derivatif diniagakan di luar bursa dengan margin, yang bermakna ia membawa tahap risiko yang tinggi dan terdapat kemungkinan anda boleh kehilangan seluruh pelaburan anda. Produk-produk ini tidak sesuai untuk semua pelabur. Pastikan anda memahami sepenuhnya risiko dan pertimbangkan dengan teliti keadaan kewangan dan pengalaman dagangan anda sebelum berdagang. Cari nasihat kewangan bebas jika perlu sebelum membuka akaun dengan BCR.
BCR Co Pty Ltd (No. Syarikat 1975046) ialah syarikat yang diperbadankan di bawah undang-undang British Virgin Islands, dengan pejabat berdaftar di Trident Chambers, Wickham’s Cay 1, Road Town, Tortola, British Virgin Islands, dan dilesenkan serta dikawal selia oleh Suruhanjaya Perkhidmatan Kewangan British Virgin Islands di bawah Lesen No. SIBA/L/19/1122.
Open Bridge Limited (No. Syarikat 16701394) ialah syarikat yang diperbadankan di bawah Akta Syarikat 2006 dan berdaftar di England dan Wales, dengan alamat berdaftar di Kemp House, 160 City Road, London, England, EC1V 2NX. Open Bridge Limited bertindak semata-mata sebagai pemproses pembayaran untuk BCR Co Pty Ltd dan tidak menyediakan sebarang perkhidmatan kewangan, perdagangan atau pelaburan bagi pihaknya. Peranan Open Bridge Limited adalah terhad kepada pemprosesan pembayaran.


 English
 简体中文
简体中文
 繁體中文
繁體中文
 Bahasa
Melayu
Bahasa
Melayu
 Tiếng
Việt
Tiếng
Việt
 ไทย
ไทย
 日本語
日本語
 한국어
한국어
 ភាសាខ្មែរ
 español