


0
The US Dollar Index
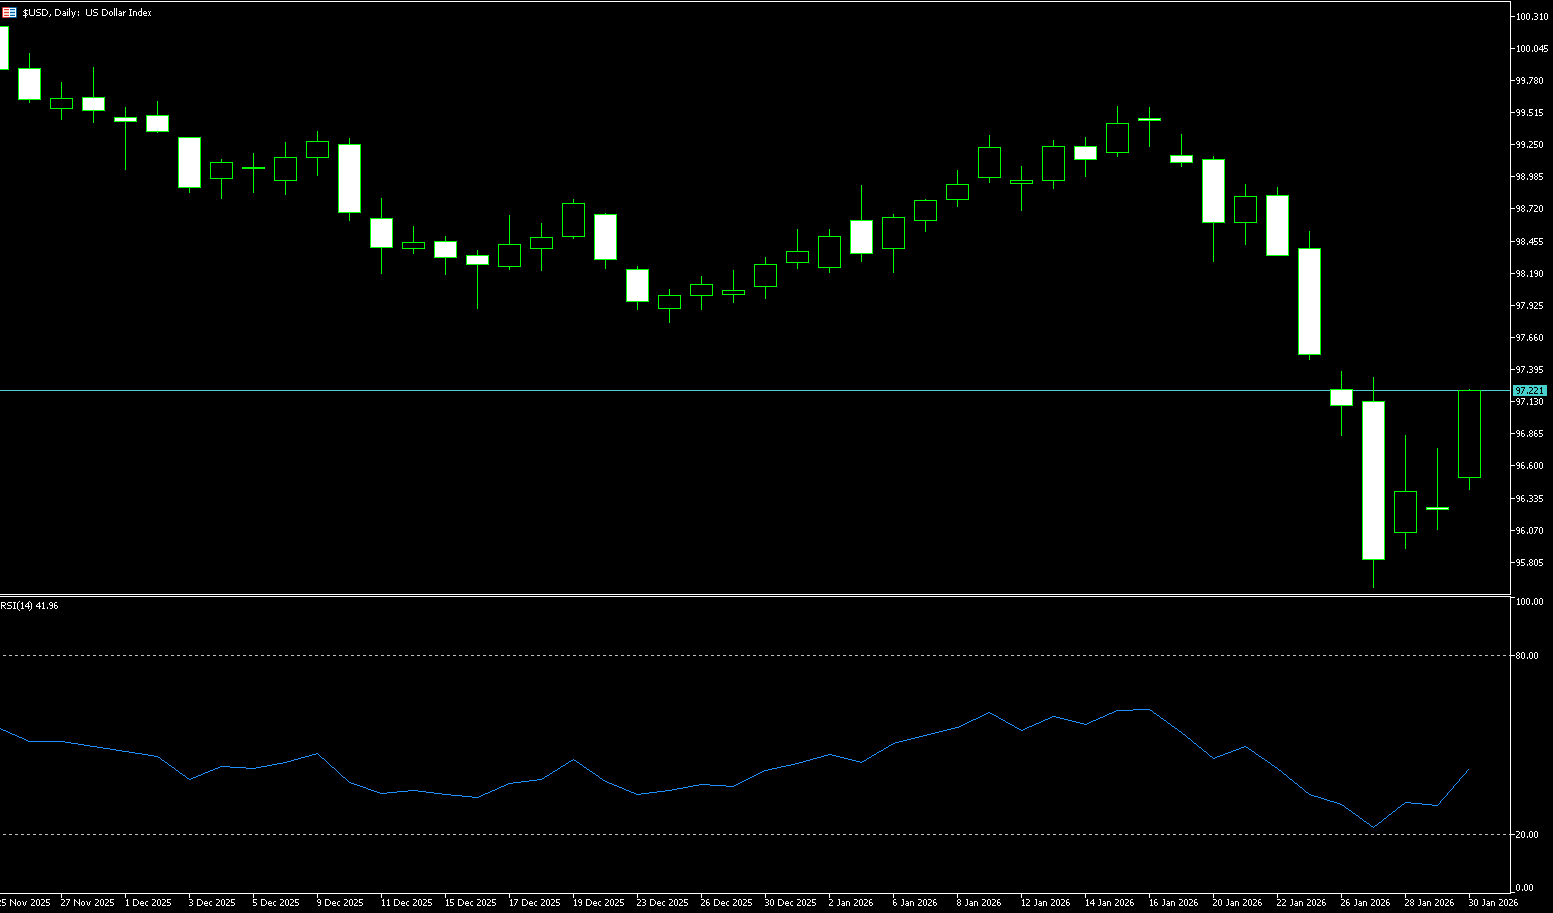
The US dollar index experienced a sharp drop followed by a rebound last week, recovering most of its losses, but it is still on track for a second consecutive week of decline. It plunged to a four-year low of 95.56 at the beginning of the week before rebounding to near 97.10 by the end of the week. This was due to escalating geopolitical tensions and policy changes in Washington impacting investor confidence in the reserve currency. In recent developments, President Trump threatened tariffs on countries exporting oil to Cuba and warned of potential military strikes against Iran if it did not sign the nuclear agreement. Meanwhile, Trump indicated he would announce his choice for Federal Reserve Chair on Friday morning, after months of pressure on Powell to more aggressively lower borrowing costs. Elsewhere, the White House and Senate Democrats reached a temporary agreement to avert a government shutdown. Earlier this week, the dollar hit a four-year low after Trump expressed little concern about its weakness, followed by Treasury Secretary Scott Bessant reiterating the US commitment to a strong dollar policy. On the other hand, President Trump reached an agreement with Senate Democrats that could avert a government shutdown and buy more time for negotiations on measures to limit government immigration cuts. It remains unclear how quickly the House will process these appropriations bills after they pass the Senate. The closing deadline is Friday midnight. The US dollar exchange rate has temporarily stabilized and rebounded.
The US dollar index rebounded after accelerating its decline last week, falling from 97.34 to 95.56 before rebounding above 97.10. The medium-term weakness remains unchanged. Although there is a short-term need for a rebound due to oversold conditions, the overall trend remains intact. The daily chart shows consecutive negative closes. If it breaks below the 97.00 medium-term support, further downside potential will open up. The moving average system is bearish, with lower highs and higher lows, indicating a complete medium-term downtrend. The RSI has entered oversold territory, suggesting a technical correction is needed, but there is no clear bullish divergence, making a rebound unlikely to change the medium-term weakness. The MACD has formed a death cross below the zero line, with bearish momentum dominating. Although there are signs of decreasing volume, a golden cross has not yet appeared, indicating insufficient reversal signals. A break below 97.00 (psychological level) and 97.22 (9-day simple moving average) could trigger a new round of downward movement. In the short term, the psychological level of 96.00 is the primary support. A break below this level would indicate a continuation of the medium-term downtrend, potentially testing 95.56 (last week's low) or even the psychological level of 95.00. If the price unexpectedly breaks through and holds above the psychological level of 97.00, it might enter a period of consolidation due to factors such as a hawkish Fed policy and risk aversion, but the medium-term weakness would be difficult to reverse. A break above the 10-day simple moving average and the psychological level of 98.00 would be necessary for relief.
Today, consider shorting the US dollar index near 97.25; stop loss: 97.37; target: 96.90; 96.80
WTI Crude Oil
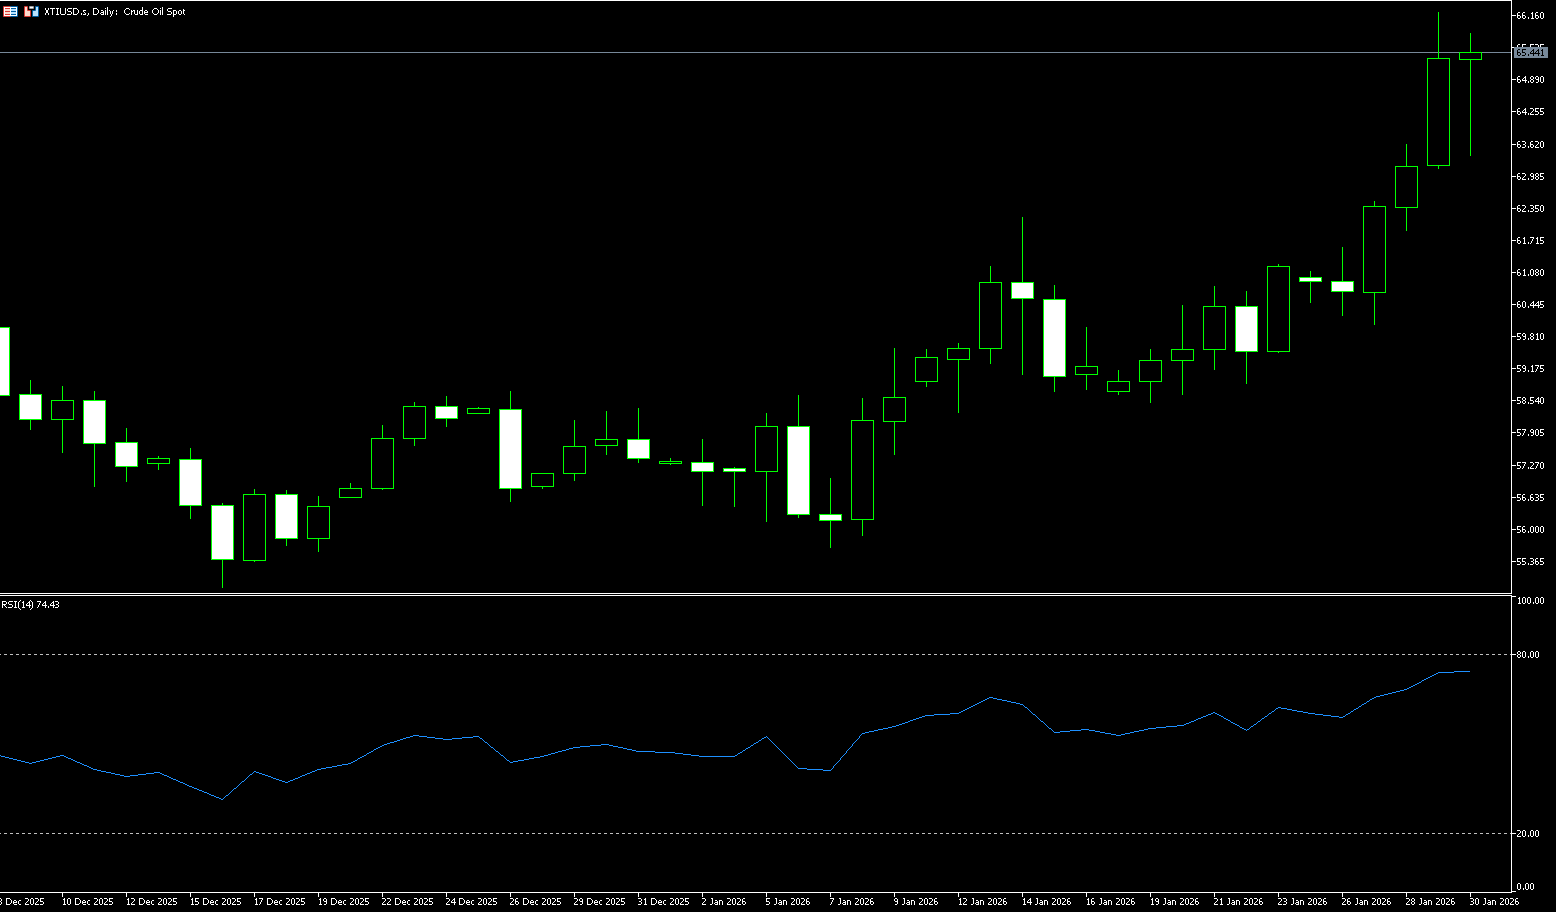
WTI crude oil was on track for its best month since July 2023 last week, reaching a high of $66.24 per barrel, supported by rising geopolitical risk premiums. Renewed tensions between the US and Iran have sparked concerns after President Donald Trump called on Iran to participate in nuclear negotiations, while Tehran warned of retaliatory measures. Markets are focused on the potential impact of these tensions on shipping through the Strait of Hormuz, a narrow passage between Iran and the Arabian Peninsula crucial for global energy flows, through which tankers transport crude oil and liquefied natural gas daily. Earlier this month, oil prices were also supported by geopolitical tensions in Venezuela, production disruptions in Kazakhstan, a freeze on US production, and tightening US restrictions on Russian oil purchases, factors that have contributed to year-to-date price increases despite anticipated oversupply. Furthermore, major Wall Street investment banks have raised their full-year crude oil price forecasts, indicating a shift in the pricing logic of the oil market. Against the backdrop of unchanged global supply growth expectations, geopolitical uncertainty in the Middle East has become the core factor driving oil prices higher. The daily chart for US crude oil shows prices stabilizing and rebounding at a key support level, with technical and sentiment factors converging, and short-term risk premiums once again dominating the market.
Last week, WTI crude oil prices broke out strongly and then fluctuated at high levels. During the week, prices surged from above $60 to around $66.24 before falling back to around $65.50 before the weekend. The overall bullish pattern is established, but a short-term correction is needed. The daily chart shows three consecutive days of large bullish candles, with the price steadily moving upwards. The moving average system is in a bullish alignment, with the 100-day moving average crossing above the 200-day moving average, forming a "golden cross," indicating a clear medium-term upward trend. The pullback before the weekend is a technical correction after the strong upward movement, showing the potential for a flag pattern. The effectiveness of the support at the lower edge of the flag ($63-$62.5) needs to be monitored. The 100/200-day moving average golden cross provides short-term support for the upward medium-term trend. The RSI provides effective short-term support around 70, indicating that the medium-term bullish trend has not weakened, but a short-term correction is needed. The MACD golden cross, with increasing momentum above the zero line and the histogram expanding and turning downwards at a high level, suggests weakening momentum, indicating a bullish medium-term outlook but increasing risk of a short-term pullback. Geopolitical risk premiums and declining inventories are supporting oil prices, with a bullish technical outlook. In the short term, the pullback at the end of last week was a normal correction. If the support level of $61.94 (200-day moving average) - $61.00 (psychological level) holds, an upward trend is likely to resume after the adjustment. If it breaks through last week's high of $65.25, it may return to the $68-$70 range for fluctuation.
Today, consider going long on crude oil around 65.35; Stop loss: 65.20; Target: 66.70; 66.90
Spot Gold
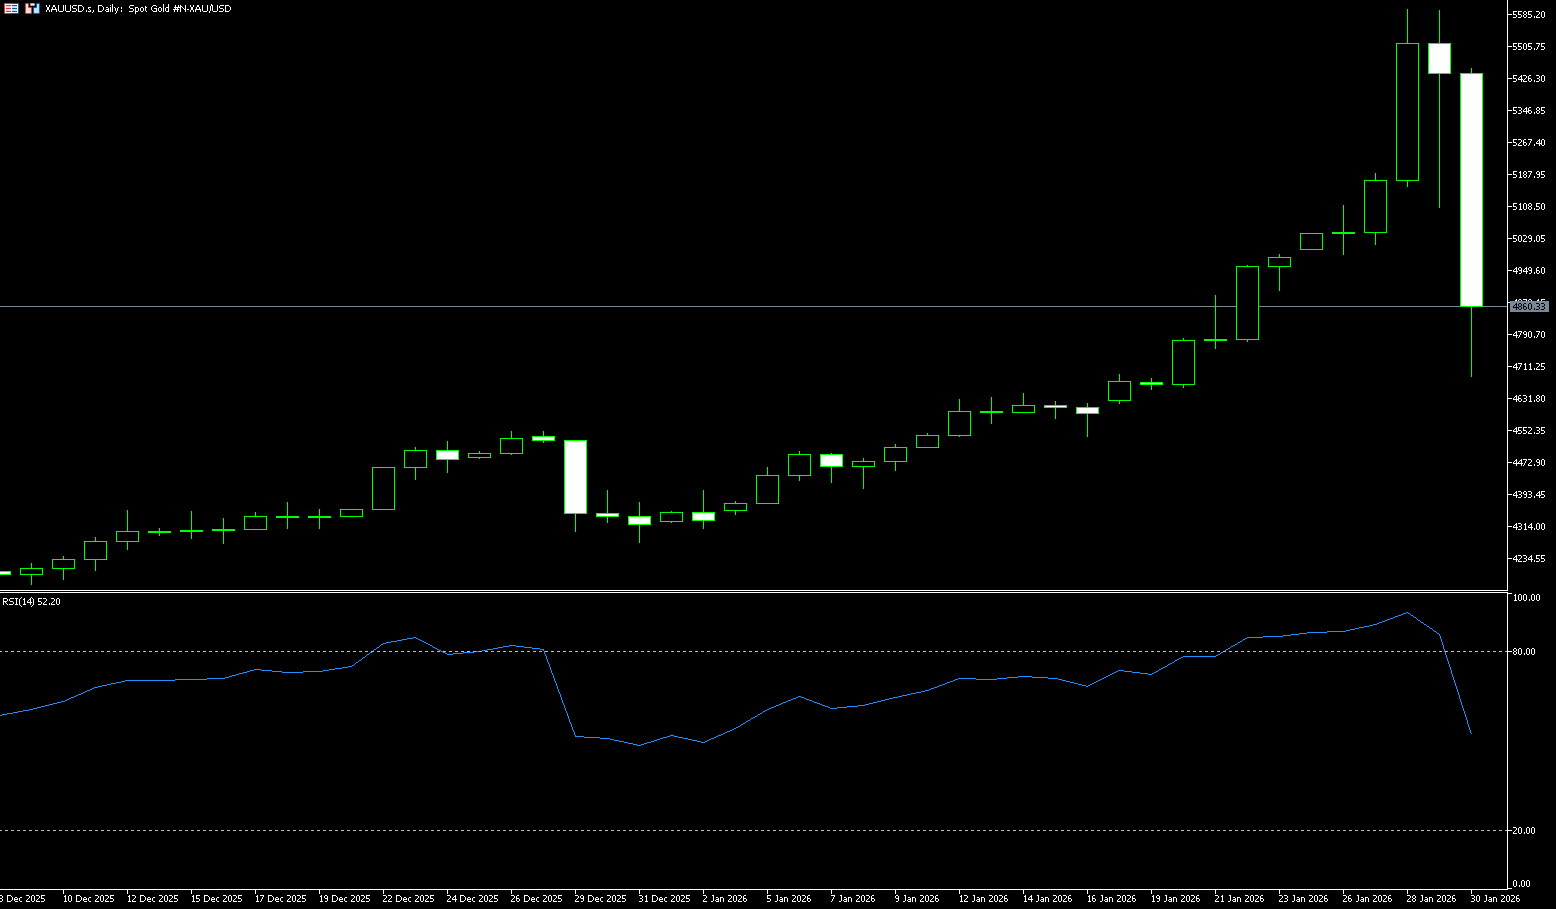
Spot gold surged to a record high of $5,598 per ounce last week, but then plummeted, falling more than 5% to an intraday low of $4,942. It then rebounded above $5,100 before turning downwards again to $4,682. Gold plunged more than 10% on Friday, finally closing at $4,850 per ounce, as profit-taking triggered a broad correction in precious metals. This decline followed Thursday's surge to a record $5,608. Despite this, prices are still on track for a sixth consecutive month of gains, their best performance since the 1980s, all driven by increased economic and geopolitical uncertainty and a persistently weak dollar. Geopolitical risks remain high after President Trump signed an executive order imposing tariffs on goods from countries supplying oil to Cuba, a move that has put pressure on Mexico. Tensions in the Middle East have also escalated, with Trump urging Iran to engage in nuclear negotiations, while Tehran warned of retaliation and vowed a swift response. On monetary policy, Trump announced his nomination of former Federal Reserve Governor Kevin Warsh as the next Fed chairman, ending months of speculation about the future leadership of US monetary policy. Furthermore, holdings in the world's largest gold exchange-traded fund, SPDR Gold Trust, have risen to a near four-year high, and spot gold has risen approximately 24% so far this month, on track for its best monthly performance since the 1980s, thanks to a persistent geopolitical risk premium.
Last week, spot gold experienced an extreme price action of "surge - plunge - consolidation," hitting a record high of $5,598 per ounce before a sharp pullback triggered by profit-taking and a shift in policy expectations. Technically, short-term overbought risks have been released, and while the medium-term bullish structure remains, consolidation is needed. Last week, a super rollercoaster candlestick pattern with a long upper shadow and a long lower shadow was recorded, indicating an extremely amplified divergence between bulls and bears. The pullback continued before the weekend, with the price falling below the short-term moving average, indicating a weakening of short-term bullish momentum. The RSI indicator quickly fell from the overbought zone (89) to (54), and the MACD red bars shortened, showing signs of forming a death cross, indicating a significant weakening of upward momentum. As for the moving averages: the price is still above the 20-day, 50-day, 100-day, and 200-day moving averages, and the moving average system remains in an upward arrangement, indicating that the medium-term bullish trend has not been completely destroyed. In the short term, it is highly likely that the price will continue to fluctuate within the range of 4,769.20 (20-day moving average) to 5,451 USD (last Friday's high), digesting the negative news and overbought risks, and waiting for new directional guidance. Medium-term: If the price holds above the $4,772 (January 22nd low) and $4,769 (5-day moving average) area, a consolidation phase followed by a potential resumption of the upward trend is possible. A break below these levels could lead to a further decline to $4,475 (50-day moving average), indicating a weakening medium-term trend. Therefore, downside support lies at $4,224 (50-day moving average), with a further target of $4,000 (psychological level). On the upside, the first resistance level is at $5,000 (psychological level), followed by $5,451 (last Friday's high), and then the previous high of $5,598.
Today, consider going long on gold around 4,840; Stop loss: 4,830; Target: 4,890; 4,920
AUD/USD
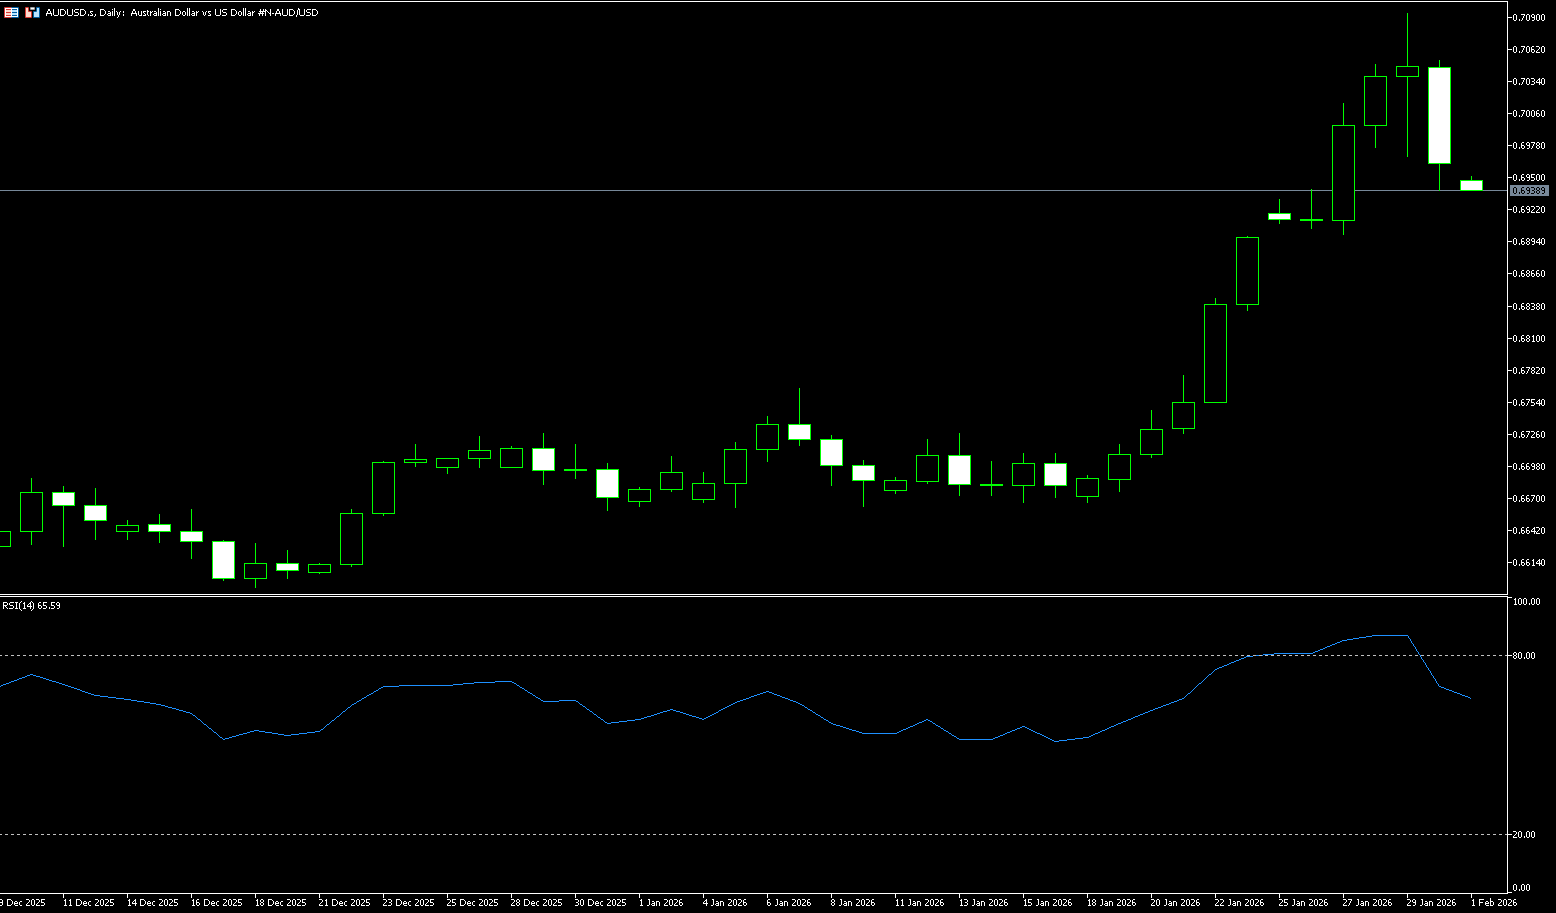
The Australian dollar briefly traded above US$0.70 last week, hovering near a three-year high, and rose for the second consecutive week amid a weaker US dollar and rising expectations of a domestic rate hike next week. The Australian dollar may regain support as stronger-than-expected Australian inflation data released earlier this week increased the likelihood of a rate hike by the Reserve Bank of Australia (RBA) next week. The market expects a roughly 70% probability of a 25 basis point increase in the cash rate, with a projected tightening of 50 basis points for the year, following the higher-than-expected inflation data. The RBA will meet on Tuesday, with all four major banks expected to raise rates to 3.85%, although some uncertainty remains regarding whether an agreement will be reached. Economists predict a hawkish stance but believe this rate hike is a one-off adjustment rather than a signal of continued tightening. If the Reserve Bank of Australia raises interest rates, it will join Japan as the only developed-country central bank to do so, despite the US Federal Reserve still projecting two rate cuts this year. The US dollar remains under pressure and may face further downside due to President Trump's new tariff threats and escalating geopolitical tensions.
The Australian dollar continued its medium-term upward trend against the US dollar, rising to 0.7095 during the week before slightly retreating. Overall, the pair was relatively strong this week, but technical correction pressure exists. Since breaking through the 0.67 level in December 2025, a clear bullish channel has formed, with the weekly chart showing an inverted head and shoulders bottom pattern. The moving average system is bullishly aligned and diverging upwards, solidifying the medium-term upward trend. In the short term, the exchange rate has stabilized above the 9-day moving average of 0.6915, and the short-term moving averages are turning upwards, providing support for the continuation of the short-term rebound trend. The 14-day Relative Strength Index (RSI) on the daily chart has fallen back to the 70 range, approaching overbought territory. After a rapid rise, the exchange rate may experience a technical pullback of 2%-5%, with support expected in the 0.6900-0.6950 range. The MACD histogram above the zero line is expanding slightly, indicating moderate bullish momentum, but the upward momentum is weakening. Currently, a weaker US dollar, stable but unremarkable domestic data, the Reserve Bank of Australia's inclination to tighten policy again, and moderate support from China favor further gains rather than a deeper correction. The AUD/USD pair now faces initial resistance at the 2026 high of 0.7093 (January 29) and the psychological level of 0.7100. Following that is the 0.7144 level (February 2023 high). However, the overbought condition of the pair still points to a possible "technical correction" in the short term. Meanwhile, if the psychological level of 0.7000 is broken, immediate support lies at 0.6915 (9-day moving average), followed by the 0.6900 (psychological level) and the 0.6835 (14-day moving average) area.
Consider going long on the Australian dollar today around 0.6950; Stop loss: 0.6940; Target: 0.7020; 0.7030
GBP/USD
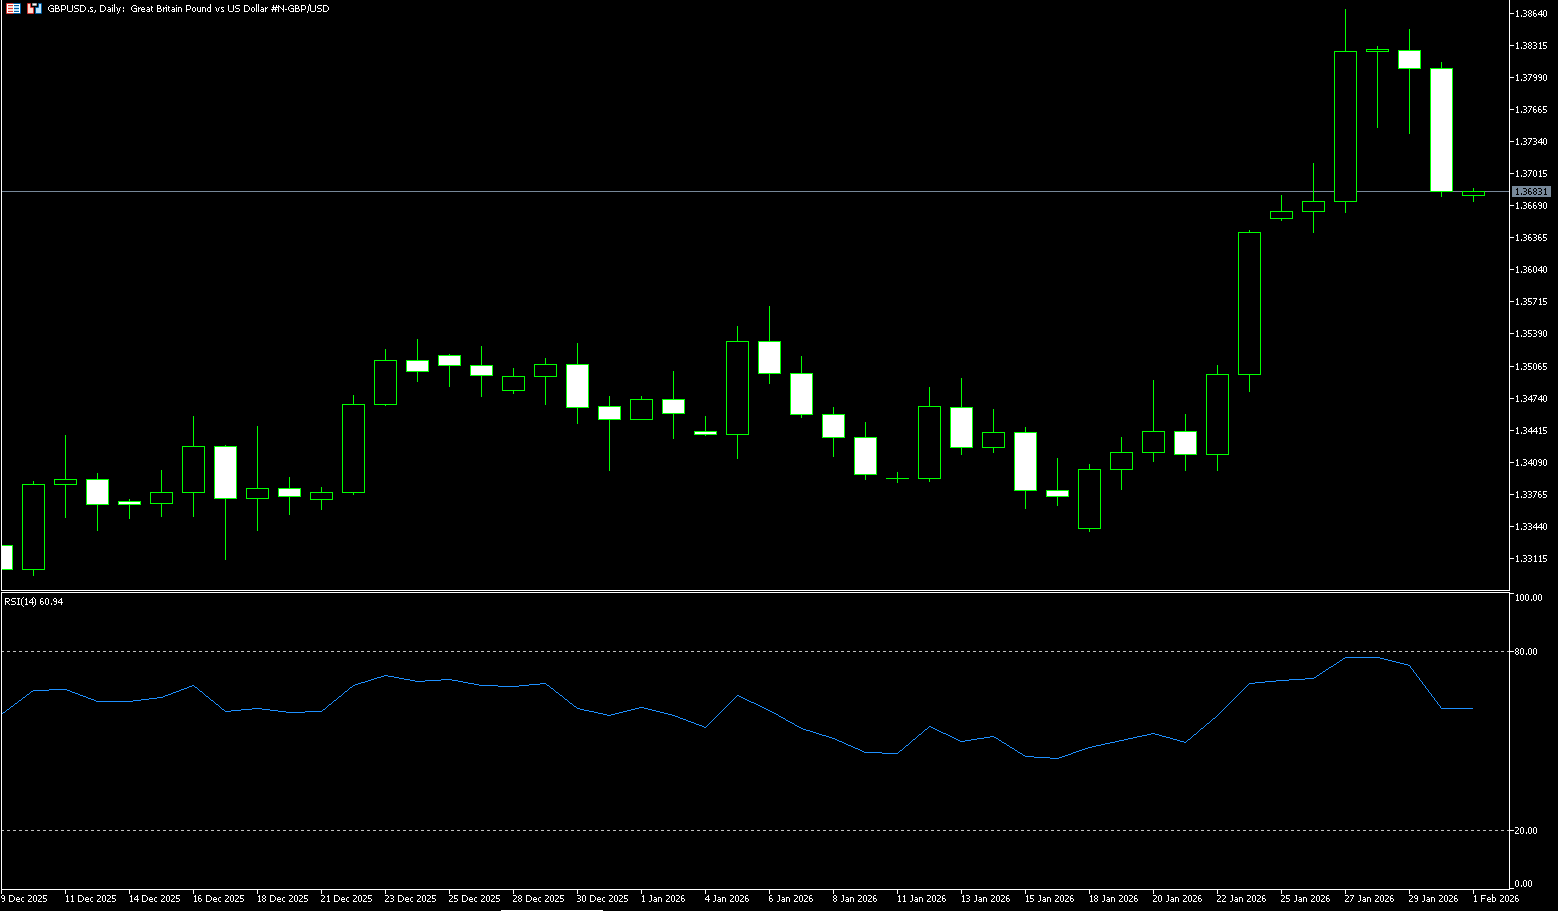
The pound fell over the weekend, remaining below 1.3700 against the dollar, after the Trump administration announced Kevin Warsh would lead the Federal Reserve. Furthermore, high producer inflation reports boosted the dollar's appeal. The pound weakened due to Warsh's Fed nomination and strong PPI, while the dollar's tone was stronger. GBP/USD traded at 1.36800, but still rose 0.34% for the week. The dollar index has recovered some ground since the announcement of President Trump's nomination of Warsh as Federal Reserve Chairman via Truth Social. The U.S. Bureau of Labor Statistics reported that the Producer Price Index (PPI) rose 3% year-on-year in December, unchanged from November, but exceeding the expected 2.7% decline. These data supported the Fed's decision to keep interest rates unchanged on Wednesday. Fed Chairman Jerome Powell stated that the labor market has stabilized, but inflation remains too high. A light UK economic calendar has led traders to focus on dollar-related developments. However, investors' focus is on next week's Bank of England monetary policy meeting, where the benchmark interest rate is expected to remain unchanged. Data from Prime Market Terminal suggests that the Bank of England is expected to ease policy by 37 basis points by the end of the year.
Last week, the pound against the dollar generally exhibited a "rise and fall, high-level fluctuation" pattern. It first touched a high of 1.3869, the highest level since 2021, before facing downward pressure, with weekly gains narrowing and short-term correction pressure becoming apparent. At the beginning of the week, the exchange rate continued its strong upward trend, once approaching the resistance zone of 1.3870. Around the end of the week, influenced by the hawkish Fed rate decision, a rebound in the US dollar, and profit-taking by long positions, it underwent a pullback, breaking below the short-term support of 1.3750-1.3700, and entered a period of high-level consolidation. In terms of technical indicators, the RSI was close to the overbought zone (74.55) at the beginning of the week, then fell back to 63.23 mid-week, and then dropped rapidly to the neutral-to-bearish zone on Friday, indicating weakening bullish momentum and increasing the risk of a short-term pullback. The MACD histogram remained positive at the beginning of the week, with both lines above the zero line, showing signs of a short-term bearish turn. The short-term moving averages (5-day and 10-day) have flattened and turned into resistance, while the medium-term moving averages are still rising. The market has shifted from a trend-driven phase to a consolidation phase. Multiple upper shadows appeared during the week, indicating heavy selling pressure around the 1.3800 (psychological level) and 1.3869 (last week's high). A break below these levels would challenge the 1.39 level and further target 1.3963 (five-year high). On the other hand, a break below the 1.3643 (last week's low) support could lead to a further pullback to the 1.3600 (psychological level).
Consider going long on GBP/USD around 1.3668 today; Stop loss: 1.3655; Target: 1.3730; 153745
USD/JPY
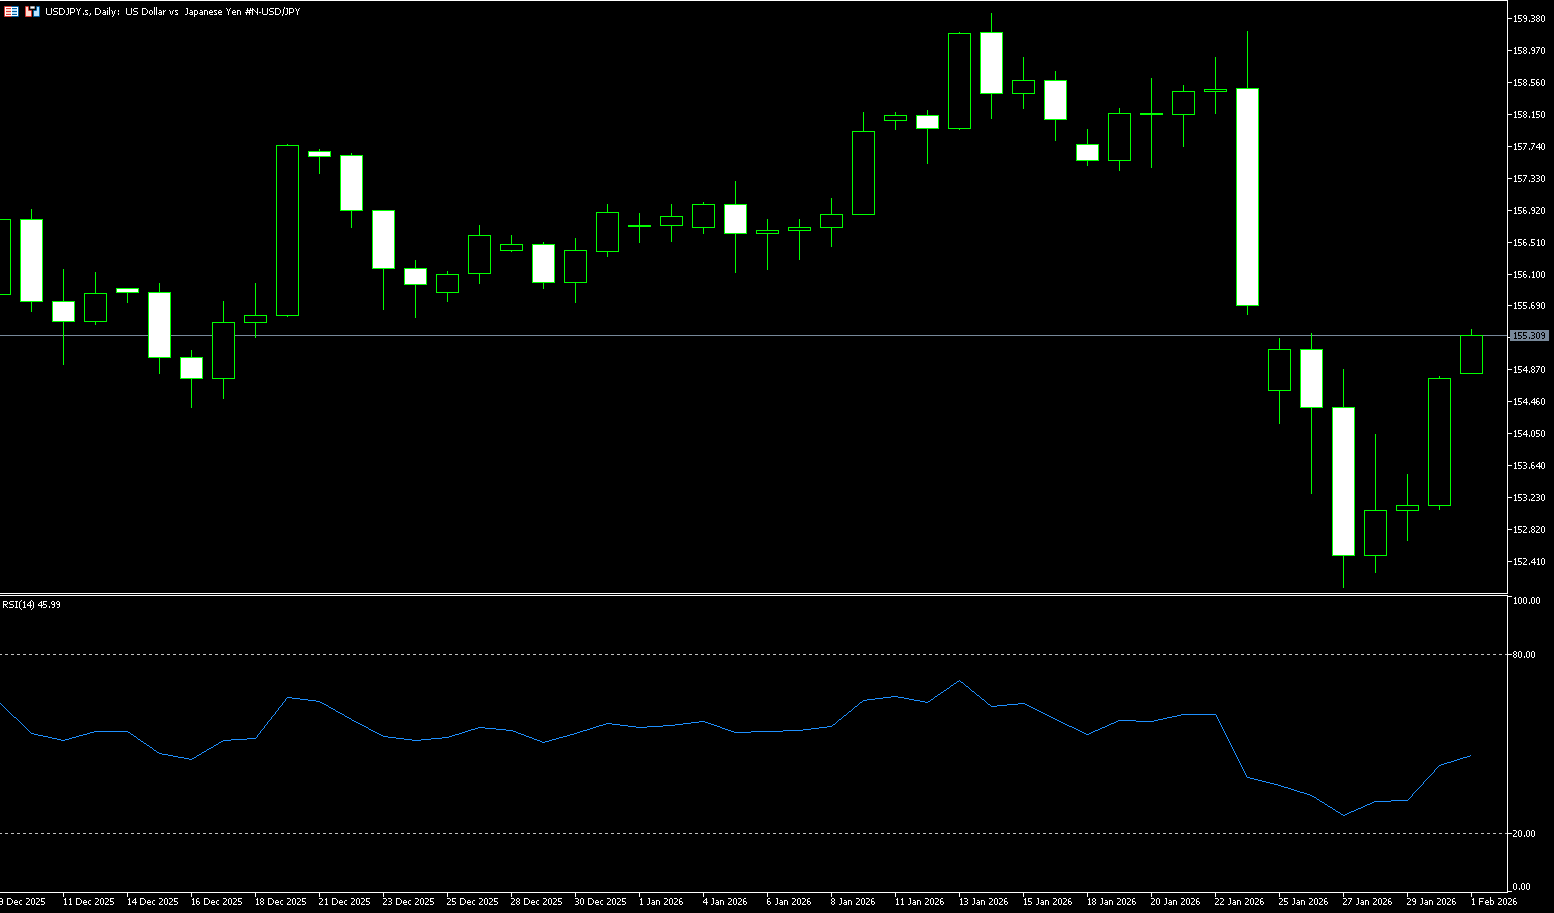
The yen fell to near 152.10 last week, its lowest level since October, but is still on track for its first monthly gain since August, as discussions of intervention pushed the currency to a four-month high, despite central bank data suggesting that authorities have not yet formally taken action. The yen has risen nearly 2% this month and as much as 4.6% since its January low. The recent rally was initially fueled by reports of a New York Federal Reserve interest rate check on USD/JPY, which sparked speculation of a possible coordinated US-Japan intervention. However, US Treasury Secretary Scott Bessant dismissed such reports, reiterating the US's commitment to a strong dollar policy. Nevertheless, traders remain cautious about the possibility of unilateral intervention by Japanese authorities, following a series of verbal warnings from local officials. On the economic front, Japanese retail sales unexpectedly fell in December, while industrial production declined less than expected. Additionally, market expectations of coordinated US-Japan intervention to strengthen the yen may prevent bearish traders from making aggressive bets. Furthermore, trade uncertainty based on US President Trump's tariff threats and geopolitical risks may limit losses on the safe-haven yen. On the other hand, concerns about the Federal Reserve's independence and the prospect of lower US interest rates have dampened bullish sentiment for the US dollar. This necessitates caution before further positioning for a USD/JPY rally.
Last week, USD/JPY initially fell sharply before consolidating, exhibiting a pattern of rising, falling, stabilizing, and rebounding. The weekly chart is likely to close with a long lower shadow, indicating intensified technical competition between bulls and bears and a clear short-term range-bound trading pattern. The daily chart shows a range-bound pattern, with the price hovering around the 5-day moving average at 153.77, indicating significant short-term consolidation. The 5-day and 10-day moving averages are intertwined, with an unclear direction and relatively balanced bullish and bearish forces. The RSI indicator is in the 38.5 range, with no overbought or oversold signals; the MACD indicator is near the zero line, with alternating red and green momentum bars, indicating frequent momentum shifts and an unclear trend direction. The 100-day simple moving average continues to rise to 153.98, while the pair remains below it, making the short-term movement appear heavy within the overall upward trend. A break above this dynamic resistance level would stabilize the outlook. The 38.2% Fibonacci retracement level of 154.77, from the high of 159.13 to the low of 152.07, should limit the initial rebound. A daily close above the latter would improve the recovery pattern and could extend gains to the 155.78 (70-day moving average) and 156 (psychological level) area as momentum normalizes. Failure to break through these resistance levels would limit the rebound and maintain a cautious bias towards the 153.00 level. A break below 152.48 (lower Bollinger Band) could lead to a further test of 151.54 (the low of October 29th last year).
Consider shorting the US dollar near 155 today; Stop loss: 155.20; Target: 154.30; 154.40
EUR/USD
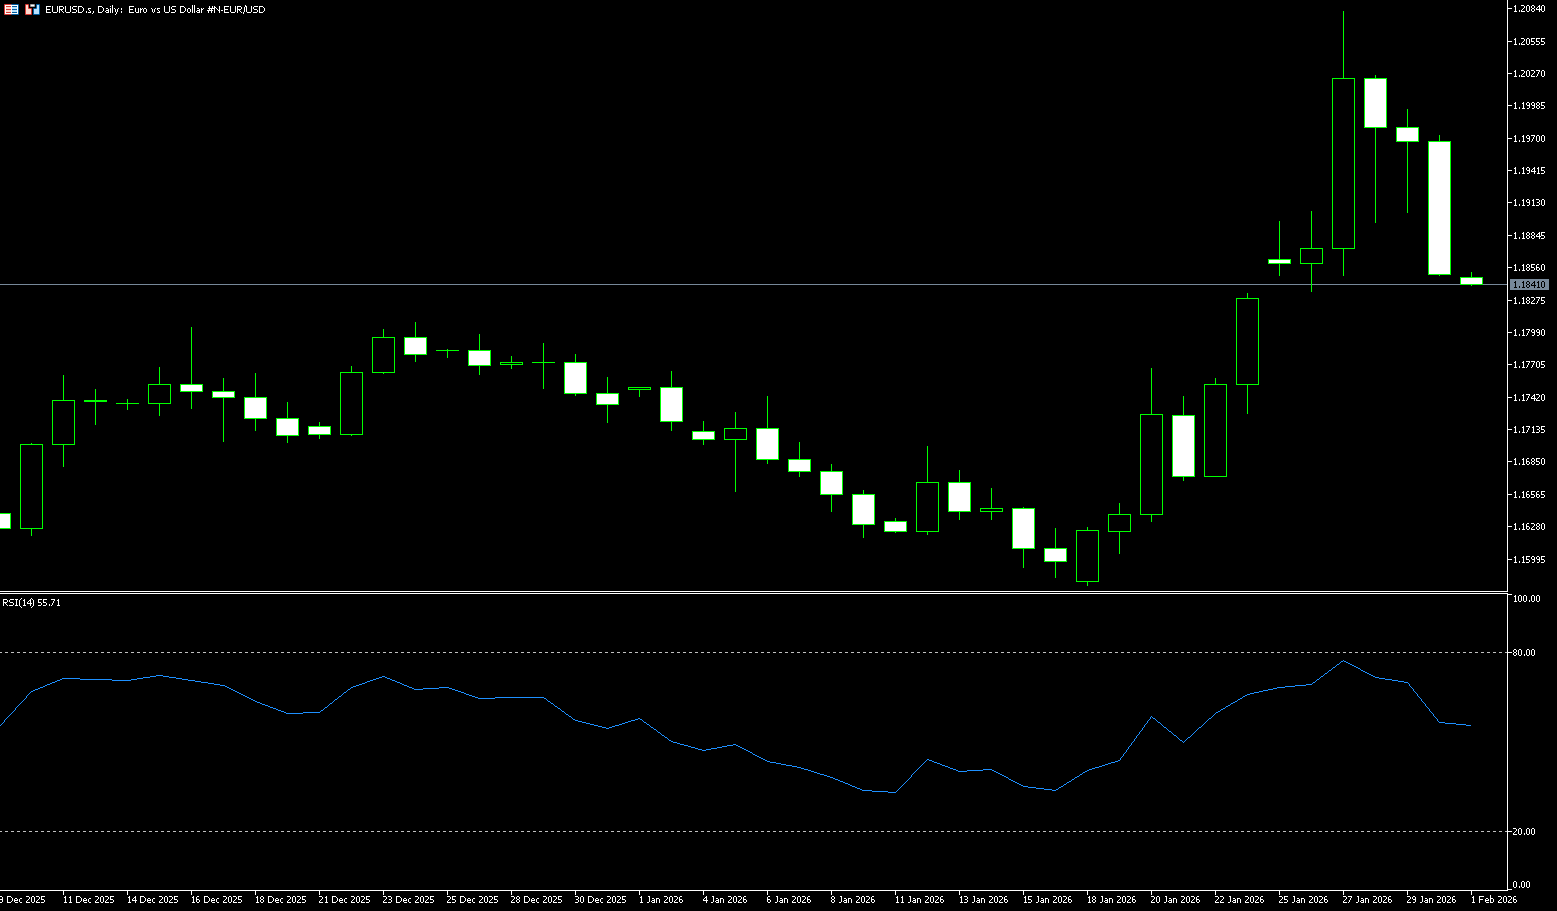
EUR/USD rose and then fell last week. At the beginning of the week, it continued its previous strength, rising to 1.2082 before coming under pressure and fluctuating around the 1.1850 level. The strengthening US dollar put pressure on the euro in the short term. New selling pressure was attracted before the end of last week, with significant price volatility the previous day, retesting levels below 1.1900. The euro fell to $1.19, retreating to near its June 2021 highs earlier this week, as a stronger dollar put pressure on the currency, following comments from US Treasury Secretary Scott Bessenter that reduced market expectations of US intervention in the foreign exchange market. Meanwhile, the Federal Reserve kept interest rates unchanged as expected, with Chairman Powell suggesting that rates might remain unchanged for some time. In Europe, European Central Bank policymaker Martin Koch warned that further strengthening of the euro could prompt the central bank to resume rate cuts. Market expectations for summer policy action have moderately increased, with the implied probability of a July rate cut rising from about 15% to about 25%. The ECB is scheduled to decide on monetary policy next week, and is widely expected to keep interest rates unchanged. Eurozone economic growth is projected at 0.3% in the third quarter of 2025, while December inflation is expected to fall to 1.9%.
Last week, the euro initially rose against the dollar, reaching a high of 1.2082 before falling back and fluctuating around the 1.1850 level. The short-term strengthening of the dollar pressured the euro. However, fundamental factors such as the resilience of the Eurozone economy and the narrowing interest rate differential between the US and Europe continue to support the euro, resulting in intense competition between bulls and bears. On the daily chart, the 5-day, 10-day, and 20-day moving averages are in a bullish alignment. Although the exchange rate has pulled back, it is still trading above the moving averages, and the medium-to-long-term bullish structure remains intact, providing some support for the exchange rate. The MACD is above the zero line, indicating that the bullish momentum is weakening, but the trend momentum has not yet exhausted. The RSI (14) has fallen from the overbought zone at the beginning of the week to the middle-high level, approaching the neutral zone, indicating that the short-term bullish strength is weakening and the market has entered a high-level turnover phase, with no clear reversal signal yet. In addition, the upward channel since the exchange rate formed a stage low of 1.1576 remains intact. This week's pullback is more of a rhythm correction during the upward trend. As long as the support at 1.1850 is not effectively broken, the upward trend may continue. The initial support at 1.1850 is the short-term bullish/bearish watershed, and 1.1850 is the support near the starting point of the rise at the beginning of last week. Then there is the 1.1748 level. On the resistance side, 1.1950 is a key level for a short-term rebound, 1.2000 is a psychological level, and 1.2081 is the previous high.
Today, consider going long on the Euro around 1.1840; stop loss: 1.1830; targets: 1.1890, 1.1900.
Disclaimer: The information contained herein (1) is proprietary to BCR and/or its content providers; (2) may not be copied or distributed; (3) is not warranted to be accurate, complete or timely; and, (4) does not constitute advice or a recommendation by BCR or its content providers in respect of the investment in financial instruments. Neither BCR or its content providers are responsible for any damages or losses arising from any use of this information. Past performance is no guarantee of future results.
Lebih Liputan


Pendedahan Risiko:Instrumen derivatif diniagakan di luar bursa dengan margin, yang bermakna ia membawa tahap risiko yang tinggi dan terdapat kemungkinan anda boleh kehilangan seluruh pelaburan anda. Produk-produk ini tidak sesuai untuk semua pelabur. Pastikan anda memahami sepenuhnya risiko dan pertimbangkan dengan teliti keadaan kewangan dan pengalaman dagangan anda sebelum berdagang. Cari nasihat kewangan bebas jika perlu sebelum membuka akaun dengan BCR.
BCR Co Pty Ltd (No. Syarikat 1975046) ialah syarikat yang diperbadankan di bawah undang-undang British Virgin Islands, dengan pejabat berdaftar di Trident Chambers, Wickham’s Cay 1, Road Town, Tortola, British Virgin Islands, dan dilesenkan serta dikawal selia oleh Suruhanjaya Perkhidmatan Kewangan British Virgin Islands di bawah Lesen No. SIBA/L/19/1122.
Open Bridge Limited (No. Syarikat 16701394) ialah syarikat yang diperbadankan di bawah Akta Syarikat 2006 dan berdaftar di England dan Wales, dengan alamat berdaftar di Kemp House, 160 City Road, London, City Road, London, England, EC1V 2NX. Entiti ini bertindak semata-mata sebagai pemproses pembayaran dan tidak menyediakan sebarang perkhidmatan perdagangan atau pelaburan.

 English
 简体中文
简体中文
 繁體中文
繁體中文
 Bahasa
Melayu
Bahasa
Melayu
 Tiếng
Việt
Tiếng
Việt
 ไทย
ไทย
 日本語
日本語
 한국어
한국어
 ភាសាខ្មែរ
 español