


0
US Dollar Index
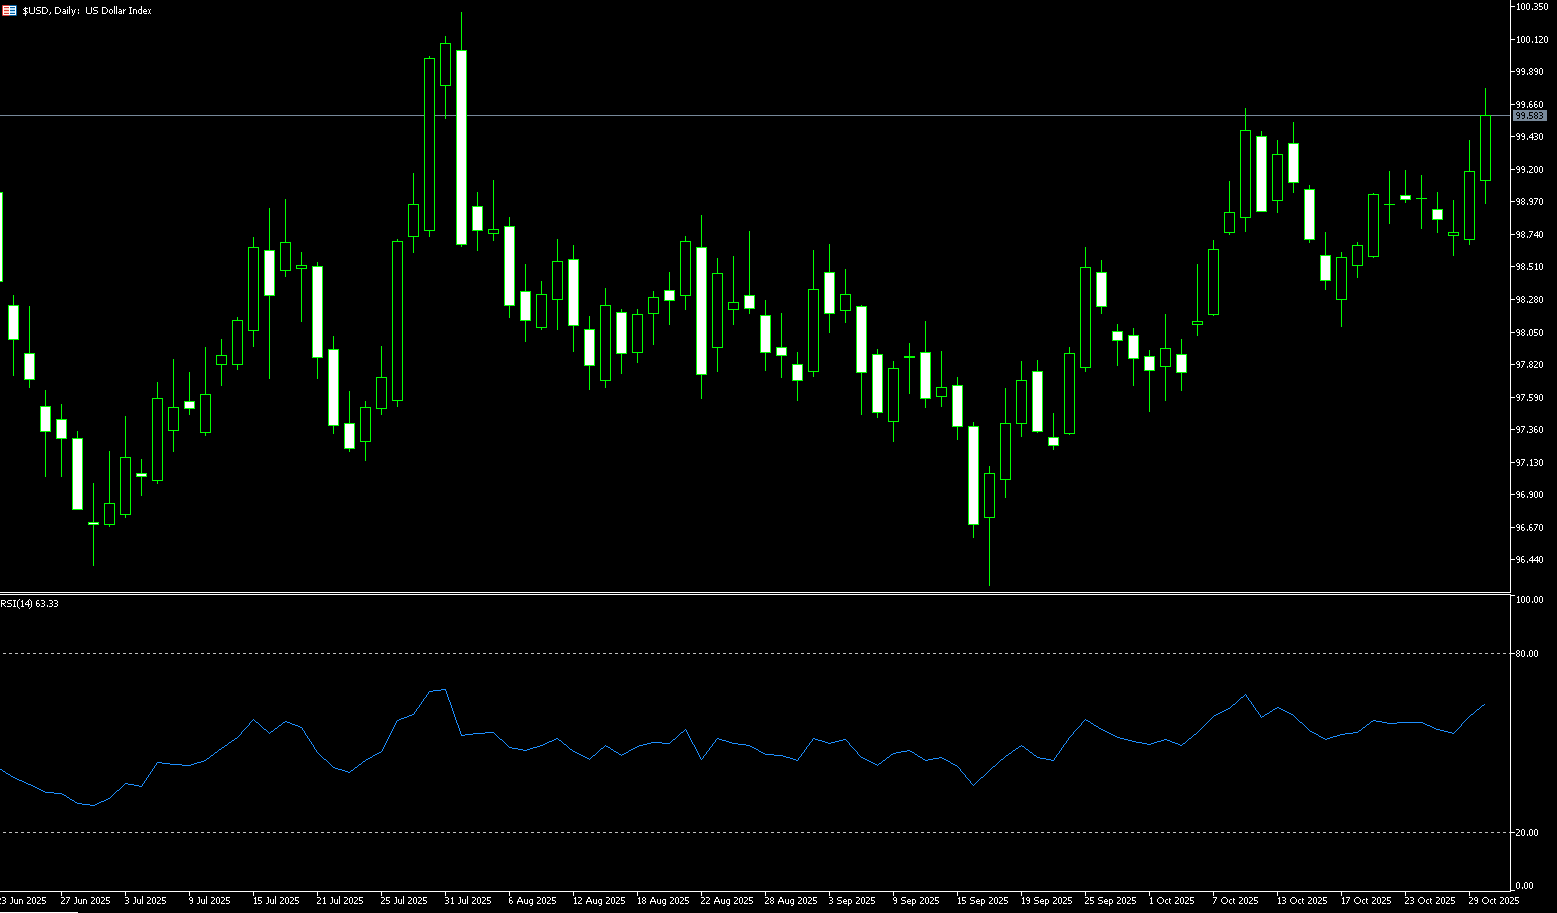
The US dollar index rose for the second consecutive trading day on Thursday to 99.50, after Chairman Powell's remarks lowered expectations for further interest rate cuts. The Federal Reserve implemented a 25 basis point rate cut on Wednesday as expected, but Powell emphasized that a December rate cut was not a certainty. Prior to the meeting, the market's implied probability of another rate cut in December plummeted from about 90% to about 68%. Investors widely expect another 25 basis point rate cut in December, in line with the Federal Reserve's September forecast. Meanwhile, following the meeting between President Trump and President Xi Jinping, the US reduced overall tariffs on Chinese imports by 10% to 47%, while Beijing pledged to limit fentanyl exports and increase purchases of US soybeans. These outcomes were widely anticipated by the market. The dollar rose the most against the yen after the Bank of Japan did not change its interest rate and rumors circulated that the central bank might not take further action this year.
If Powell downplays the probability of another rate cut in December, the dollar's rise will likely be driven by short covering and passive buying from quantitative models. Its sustainability will depend on whether the repricing of "longer and higher" rates in the following days can extend to front-end real interest rates. If he emphasizes the fragility of the employment market or hints at a "closer to neutral interest rates" approach, the dollar's decline is more likely to be a combination of "interest rate differential compression + risk asset sentiment recovery," typically unfolding in phases rather than a one-sided manner. The daily chart shows that after falling from the previous high of 99.56, the index has formed a rectangular box between 98.40 and 99.20. The upper edge is close to the resistance at 99.56 (the high of October 9th) and 99.70 (the 180-day simple moving average), while the lower edge is around the psychological support of 98.00. The current price is near the top of the box, reflecting the "price magnetism" in a consolidating market. The short-term low of 98.40 forms a second line of defense below the trading range. A break below this level would trigger a retest of the previous rebound's retracement to the 98.00 psychological level.
Today, consider shorting the US Dollar Index at 99.65, with a stop-loss at 99.78 and targets at 99.00 and 98.90.
WTI Crude Oil
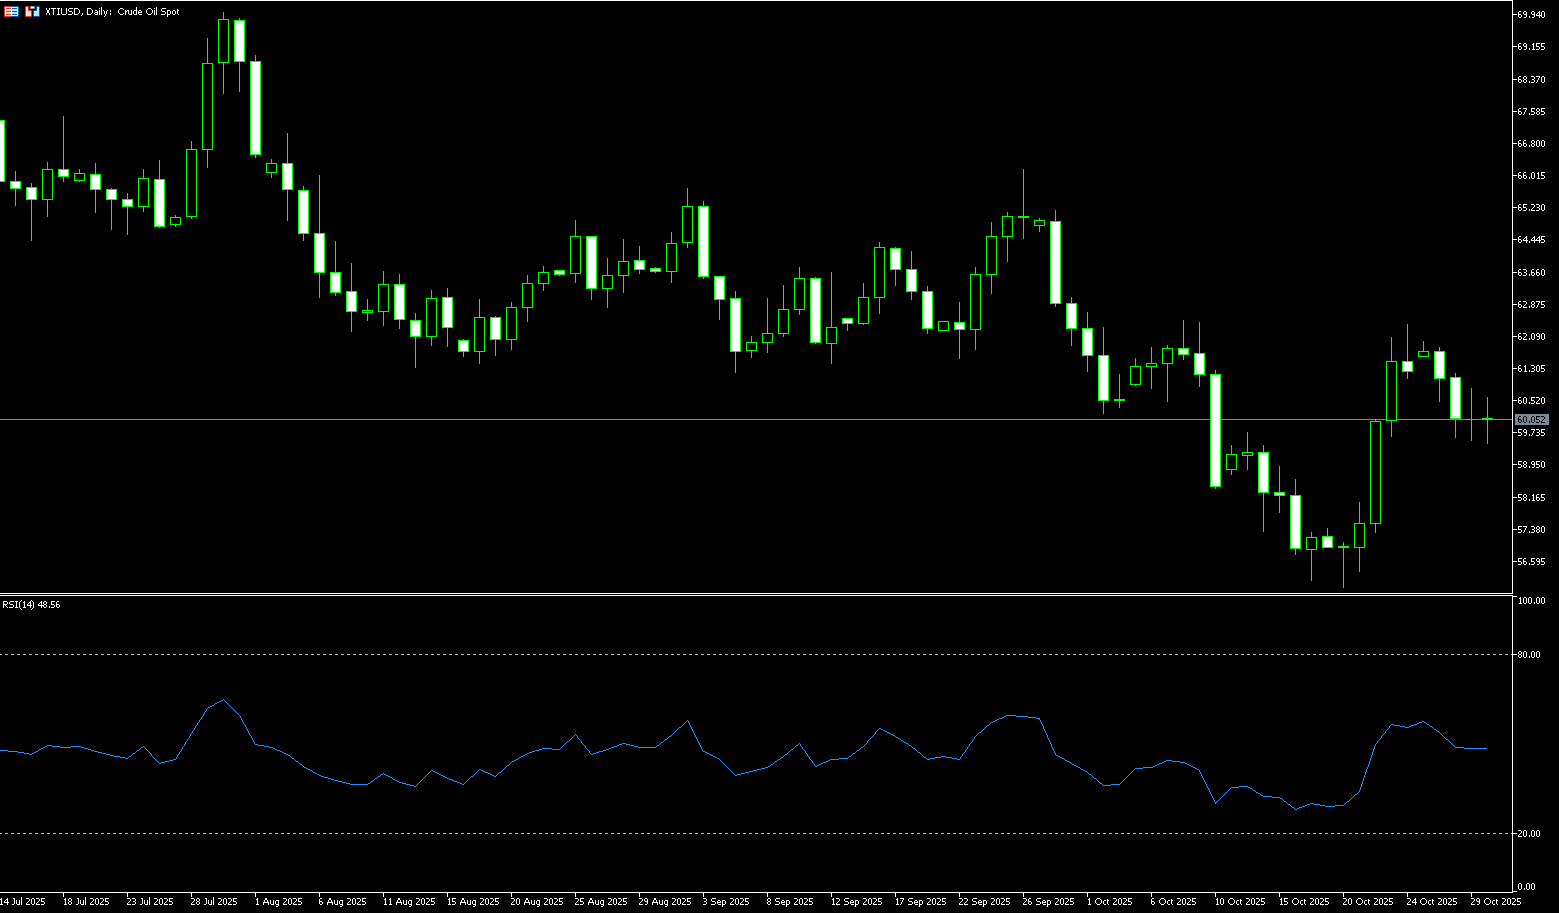
US crude oil is trading around $60.00 per barrel. This followed data showing a larger-than-expected drop in US crude oil and fuel inventories last week, and President Trump's optimism regarding trade talks, which helped ease economic tensions. Oil prices were limited by the larger-than-expected inventory decline, and also benefited from optimistic trade expectations and the fact that the US government shutdown, which has lasted for nearly a month, seems to be finally starting to change. For the week ending October 24, US crude oil inventories decreased by 6.86 million barrels to 416 million barrels, compared to analysts' expectations of a 211,000-barrel decrease. Furthermore, the US's optimism regarding trade negotiations and the agreement reached with South Korea have helped alleviate concerns about a decline in economic activity caused by Trump's tariffs and trade war. In recent months, tariffs and the trade war have fueled concerns about oil demand and dragged down crude oil prices.
From a technical perspective, the WTI crude oil daily chart shows that prices have closed lower for three consecutive days, briefly breaking below the key support levels of $60.21 (25-day simple moving average) and $60.00 (a psychological level), indicating a shift to a weak short-term trend. The MACD indicator continues to diverge downwards, showing increasing bearish momentum; the 14-day Relative Strength Index (RSI) remains around 47, not yet entering oversold territory, suggesting further downside potential for oil prices. If oil prices continue to fall below $59.56 (Tuesday's low) and $59.66 (20-day simple moving average), it could trigger a new round of declines towards the $59.00 level, followed by the $58.00 psychological level. Conversely, if oil prices regain the $61.10 level (34-day simple moving average), a short-term rebound is expected, with resistance at last week's high of $62.38.
Consider going long on crude oil today at $59.88. Stop loss: $59.70. Targets: $61.20, $61.50
Spot Gold
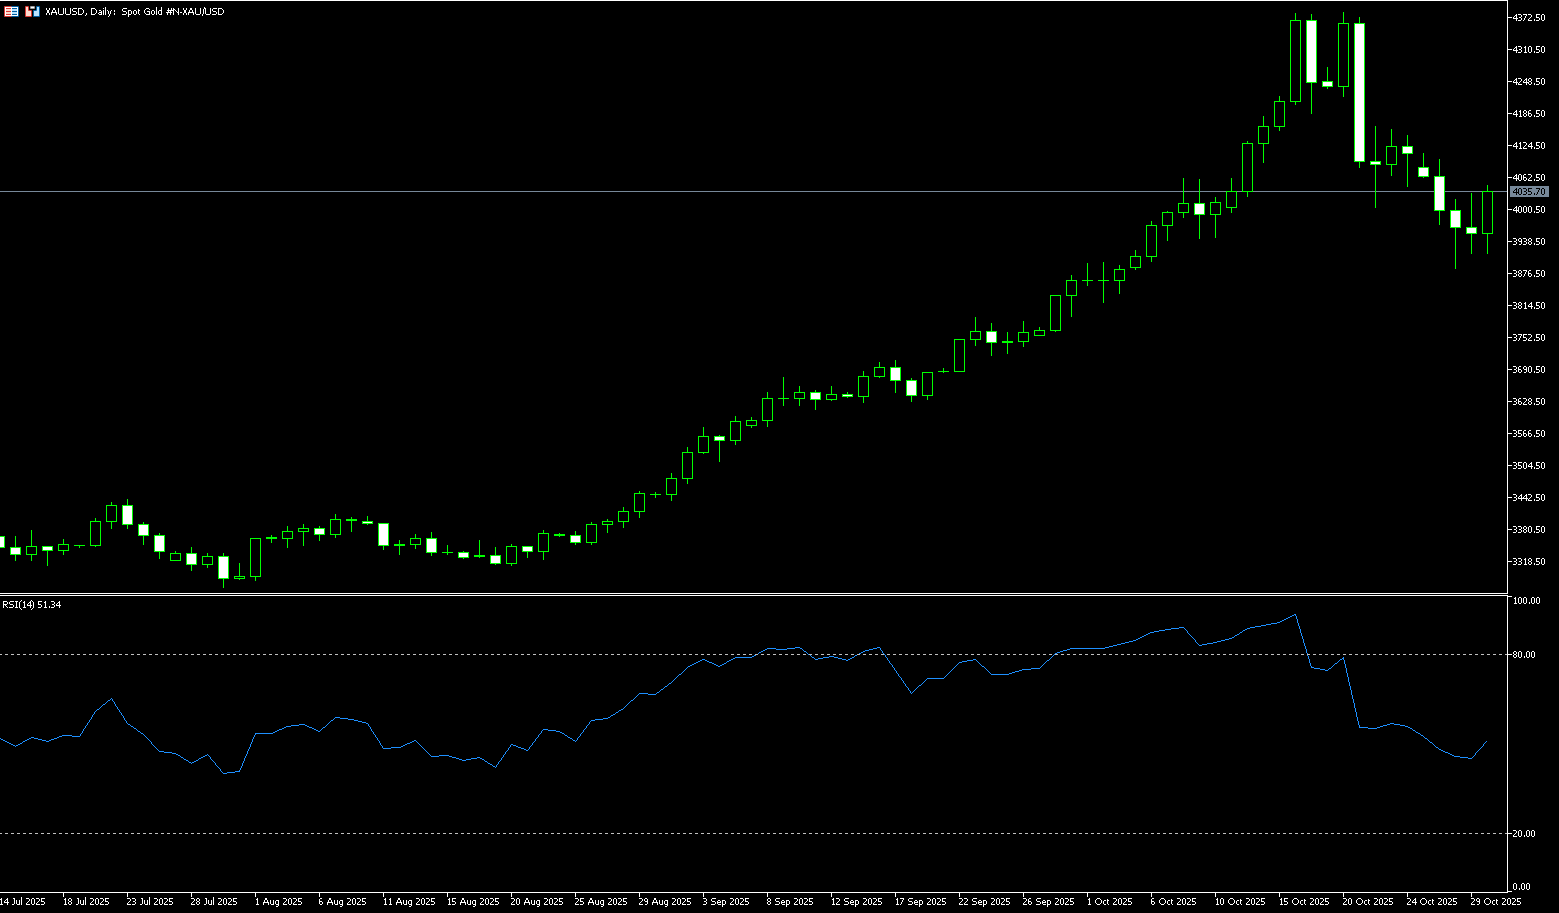
On Thursday, spot gold climbed back above $4,000/ounce. On Wednesday, spot gold experienced a dramatic rollercoaster ride. During the Asian and European sessions, driven by safe-haven demand and expectations of a Fed rate cut, gold prices surged nearly 2%, successfully breaking through the $4,000 mark. However, this rally was short-lived. The Fed cut rates by 25 basis points as expected, but Fed Chairman Powell's hawkish remarks at the press conference dampened bullish sentiment, causing gold prices to quickly give back all gains and fall, reaching a low of $3,908/ounce. This pullback has brought gold down more than 3% so far this week, partly due to signs of easing global trade tensions, despite gold prices still rising 51% year-to-date and recently hitting a record high. Additionally, gold's reaction to Powell's withdrawal of expectations for a December rate cut is understandable; federal funds rate futures have significantly reduced pricing in a rate cut, which will boost the dollar and depress gold.
The gold market is at a crossroads: Powell's hawkish shift, the strengthening of both the dollar and US Treasuries, and the complete overshadowing of the positive impact of the end of quantitative tightening. If the US-China-South Korea summit fails to bring substantial positive news, and market expectations for a December rate cut continue to cool, gold prices could fall in the short term towards the $3,800 level and the 55-day simple moving average support at $3,763 or even lower. The technical chart for gold shows the upward trend remains intact, but buyers must close above $4,000 to continue hoping to test the 20-day simple moving average at $4,077. Once gold breaks above the 20-day simple moving average, the next resistance level will be the $4,100 mark. Conversely, if the daily close is below the $3,900 psychological level, gold will face further downside, with sellers watching the October 28 low of $3,886, followed by the 55-day simple moving average level near $3,763.
Consider going long on gold today at $4,020, with a stop loss at $4,015 and targets at $4,050 and $4,060.
AUD/USD
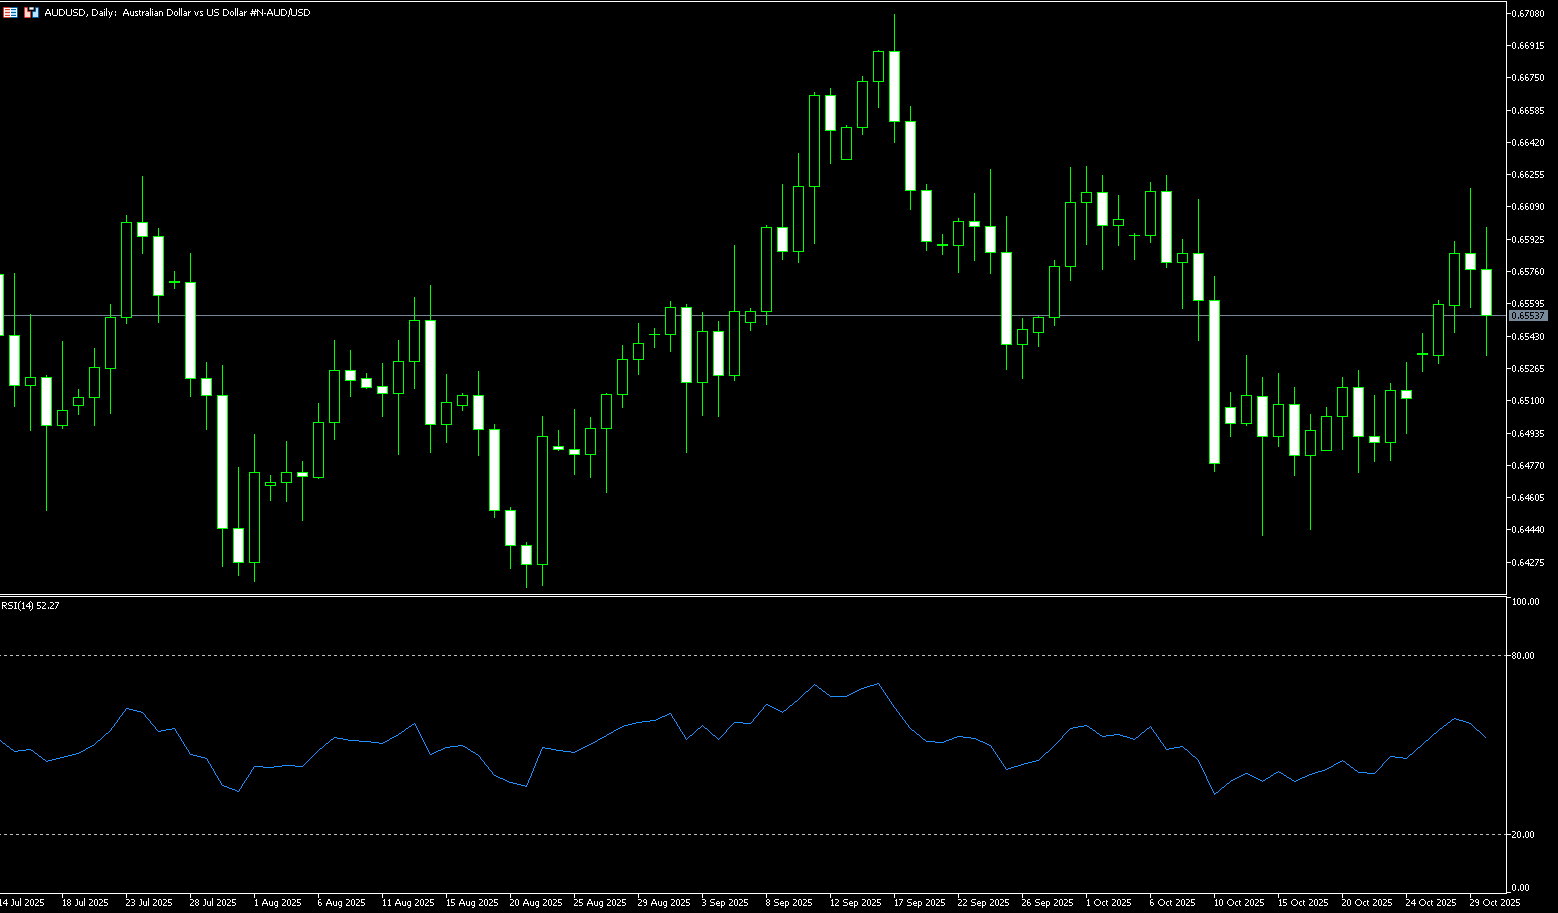
The Australian dollar traded near $0.6550 on Thursday, recovering some of the losses from the previous session, as investors awaited signals from a key meeting between US President Trump and Chinese President Xi Jinping. Hopes for progress in the negotiations boosted the risk-sensitive Australian dollar, with expectations that the two leaders would formally reach a trade truce after months of friction. On the other hand, higher-than-expected domestic inflation data dampened market expectations for a near-term interest rate cut by the Reserve Bank of Australia. The market now rates only about a 5% chance of a rate cut at the November 4th meeting and less than a 20% chance in December, reinforcing speculation that the central bank may have already ended its shallow rate-cutting cycle. Meanwhile, Federal Reserve Chairman Powell hinted that another rate cut this year is unlikely, supporting a stronger dollar.
Later this week, momentum indicators for the Australian dollar against the US dollar appear to support further gains in the short term. Specifically, the 14-day Relative Strength Index (RSI) is already slightly below 60, suggesting potential for further upside. At this stage, the pair's rebound should encounter its next resistance level at the October high of 0.6629 (October 1st), followed by the 2025 upper limit of 0.6707 (September 17th). Higher resistance lies at the 2024 peak of 0.6942 (September 30th), before the psychological level of 0.7000. Occasional weakness could prompt prices to retest the October low of 0.6440 (October 14th), an area also supported by the key 200-day simple moving average at 0.6441. A loss of this support could open the way to the August low of 0.6414 (August 21st), supported by the June low of 0.6372 (June 23rd).
Consider going long on the Australian dollar today at 0.6540, with a stop loss at 0.6530 and targets at 0.6600 and 0.6610.
GBP/USD
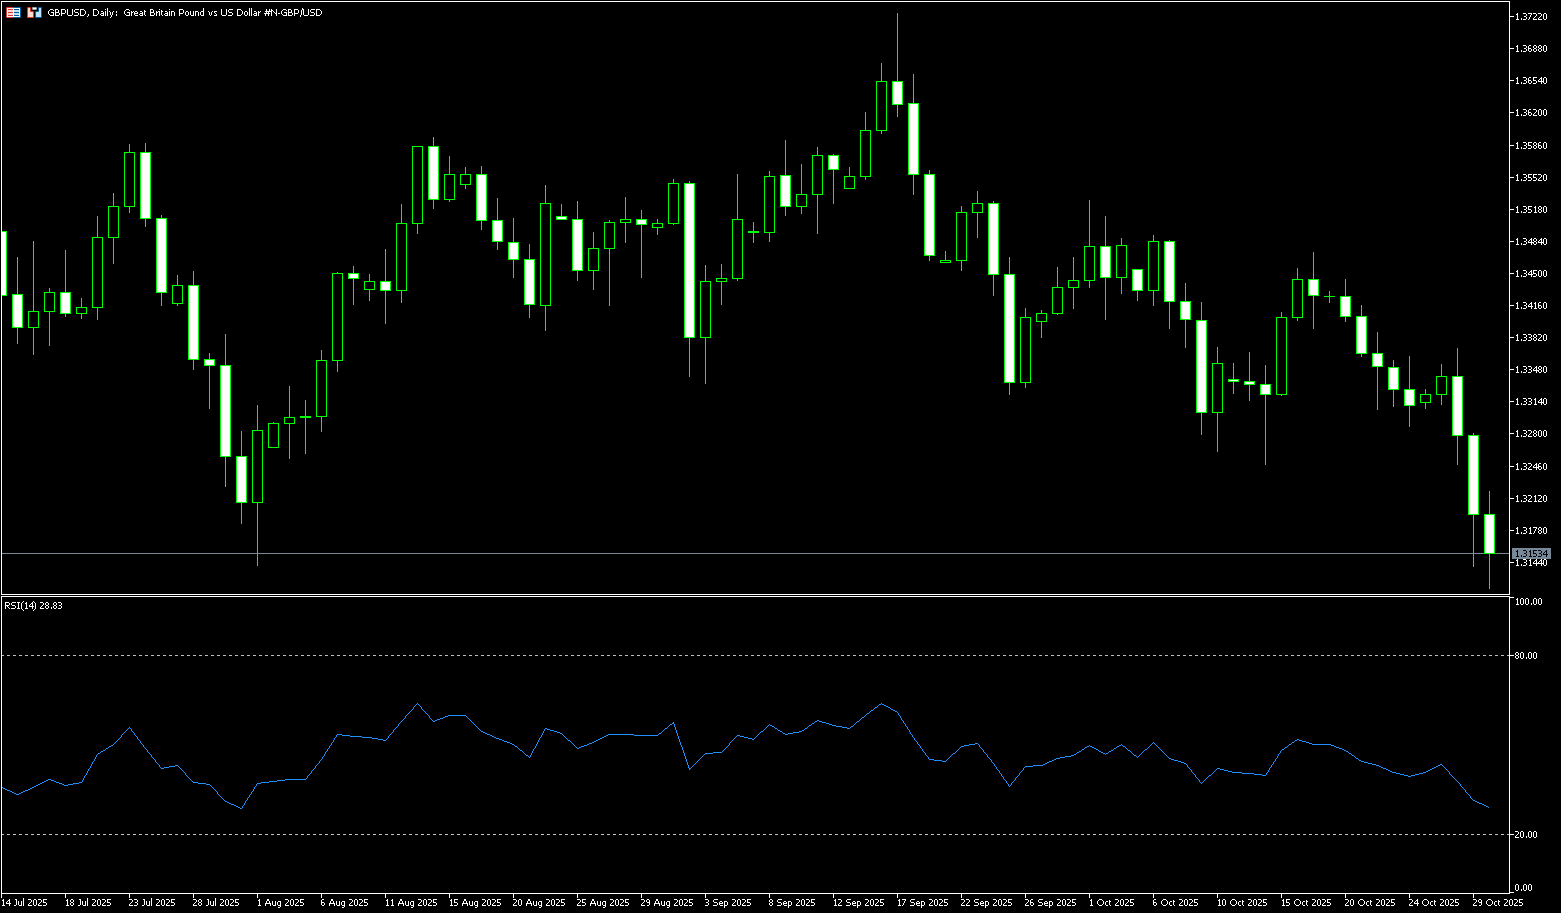
GBP/USD extended its rebound from the previous day's level of 1.3140 during Thursday's Asian session, gaining some positive momentum at that level, where 1.3116 was the lowest level since May. The spot price briefly rose above 1.3200 amid a slight weakening of the US dollar, although the fundamental backdrop still warrants caution for bullish traders. Investors remain concerned that a prolonged US government shutdown will impact economic performance, which in turn is seen as weakening the dollar and providing some support for GBP/USD. Meanwhile, Federal Reserve Chairman Jerome Powell has countered market expectations of another rate cut in December. In addition, concerns about the UK's fiscal situation and rising trader expectations of a Bank of England rate hike could further limit GBP/USD gains.
From a technical perspective, the overnight close below the 1.3200 level is considered a key trigger for GBP/USD bears. Furthermore, oscillators on the daily chart are deep in negative territory, confirming the negative short-term outlook. Therefore, a subsequent retest of the August monthly lows, around 1.3140 and the 1.3102 (250-day simple moving average) area, seems a clear possibility. A convincing break of this area would signal a new downside breakdown and pave the way for deeper losses. On the other hand, any attempt to rise above 1.3245 (the 200-day simple moving average) is more likely to attract new selling and be capped near the 1.3300 level. A sustained break above this area could trigger a short-term corrective rally and push GBP/USD towards the 1.3360-1.3365 resistance zone.
Consider going long GBP at 1.3132 today, with a stop loss at 1.3120 and targets at 1.3180 and 1.3190.
USD/JPY
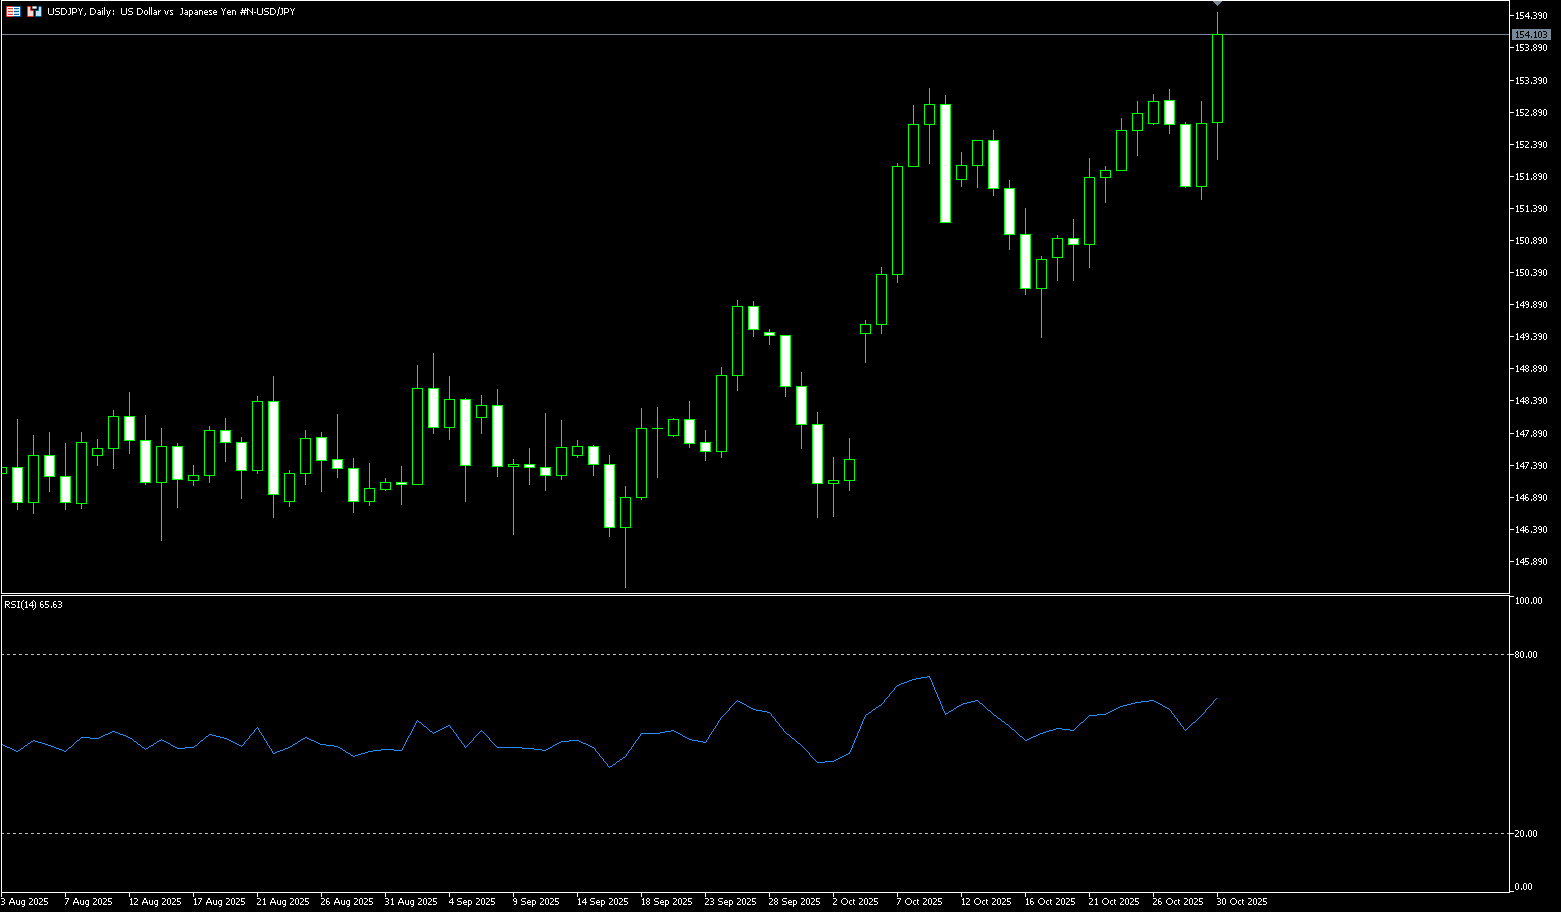
USD/JPY saw renewed buying interest on Thursday, returning above 154.00. The Bank of Japan's decision to keep its policy rate unchanged at 0.5% in October, demonstrating patience amid trade and global uncertainty, put significant pressure on the yen. Bank of Japan Governor Ueda's press conference is the next focus. Investors are cautiously awaiting the Bank of Japan's latest policy decision. However, policymakers are expected to discuss resuming rate hikes under conditions of easing tariff-related pressures and accelerating domestic inflation. Adding to the complexity of the outlook is the fact that newly elected Japanese Prime Minister Sanae Takaichi is a proponent of loose monetary policy. On Wednesday, the dollar strengthened and the yen weakened after the Federal Reserve cut interest rates by 25 basis points as expected, despite Chairman Powell's emphasis that another move in December is far from a certainty due to internal divisions and limited federal data resulting from the government shutdown.
From a technical perspective, the USD/JPY pair is finding direction around the 154.00 area; the risk lies in a dovish statement from the Bank of Japan that could disappoint investors. From a momentum perspective, dollar buyers are in control, with the 14-day Relative Strength Index (RSI) turning bullish and continuing to rise to the 64.30 level. Therefore, a push back to the 154.50 level would target the mid-February high of 154.80. The next level is 155.50. On the other hand, if the pair weakens, it will provide new hope for yen bulls, retesting 152.31 (the 9-day simple moving average), and a break above that would target 151.68 (the 20-day simple moving average) and the 151.00 area.
Consider shorting the dollar today at 154.25. Stop loss: 154.50. Target: 153.20, 153.00
EUR/USD
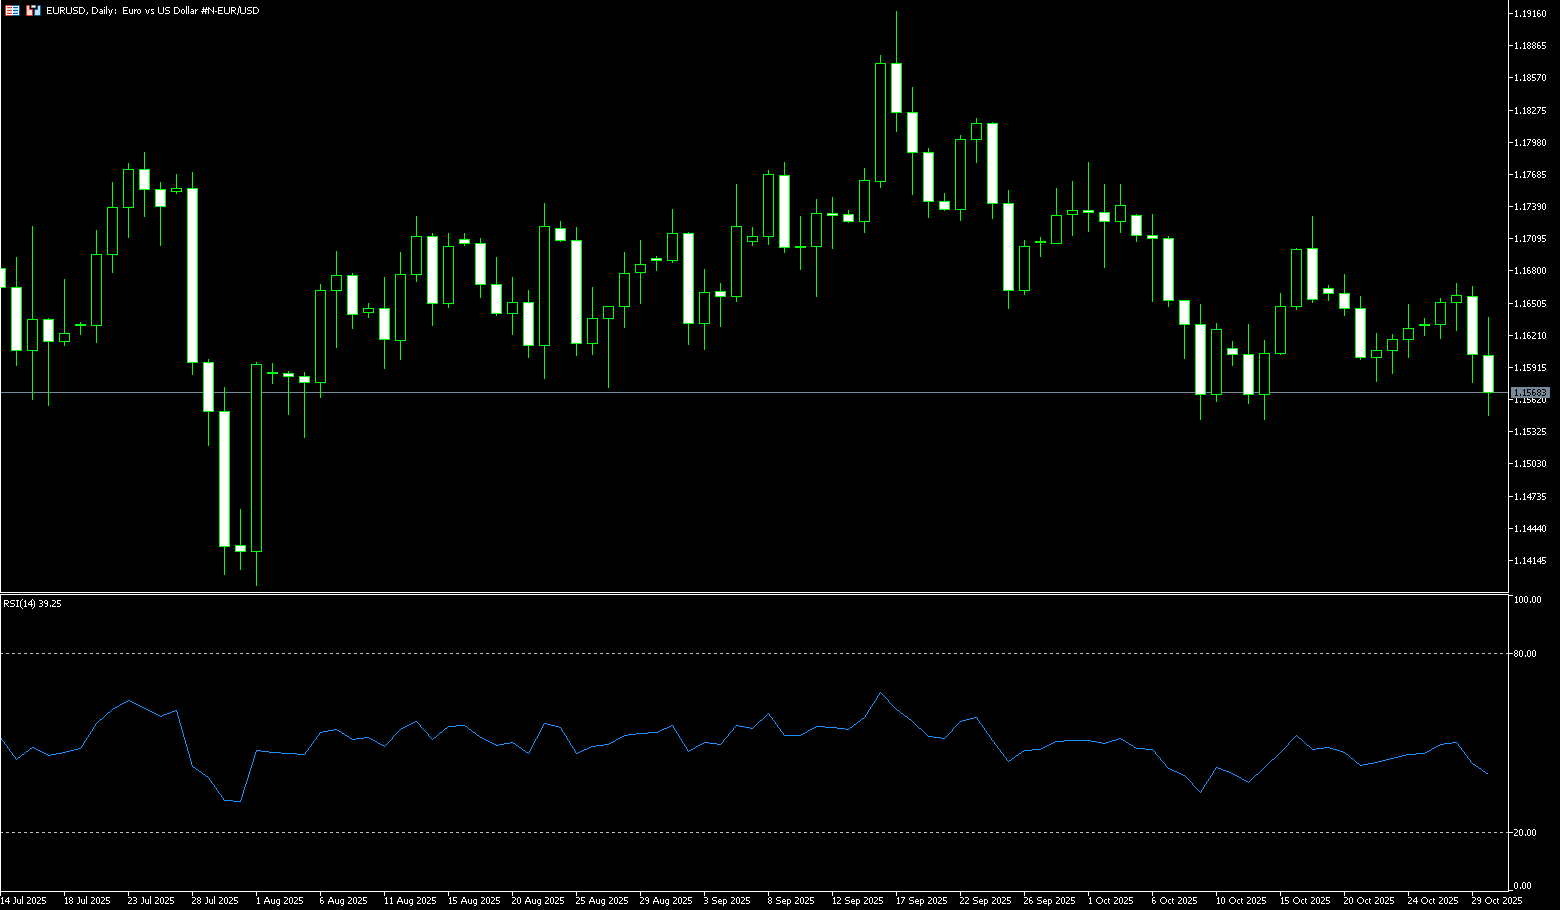
The euro fell below $1.16, hitting its lowest level since mid-October, pressured by a stronger dollar after the Federal Reserve cut the federal funds rate by 25 basis points as expected. Following the Fed's decision, Jerome Powell stated that "further cuts to policy rates at the December meeting are not a certainty, far from it." He indicated that there are differing opinions within the Federal Open Market Committee (FOMC), but most are focused on the upcoming December meeting. Powell added that there was a "feeling" some officials wanted to wait and see, commenting that the federal funds rate was neutral or near neutral based on the September Summary of Economic Projections (SEP). Following his remarks, the euro/dollar fell, breaking below 1.1600 and plunging to a five-day low of 1.1577 before recovering to around 1.1600.
The euro/dollar remains trapped in its fundamentals, but the market is still searching for direction. A dovish shift by the Fed, weakening demand for US assets, continued caution from the ECB, or genuine progress in trade could finally give the euro the boost it has been waiting for. More broadly, the outlook should remain intact as long as the pair trades above its key 200-day simple moving average. Bulls face resistance at the weekly high of 1.1728 (October 17), which precedes the October peak of 1.1778 (October 1). If further upward momentum emerges, the pair could refocus on the key psychological level of 1.1800. On the other hand, the October low of 1.1542 (October 9th and 14th) presents immediate resistance, while a deeper pullback could bring the August low of 1.1500 (a psychological level) back into focus.
Today, consider going long on the Euro at 1.1553, with a stop-loss at 1.1540 and targets at 1.1600 and 1.1610.
Disclaimer: The information contained herein (1) is proprietary to BCR and/or its content providers; (2) may not be copied or distributed; (3) is not warranted to be accurate, complete or timely; and, (4) does not constitute advice or a recommendation by BCR or its content providers in respect of the investment in financial instruments. Neither BCR or its content providers are responsible for any damages or losses arising from any use of this information. Past performance is no guarantee of future results.
Lebih Liputan


Pendedahan Risiko:Instrumen derivatif diniagakan di luar bursa dengan margin, yang bermakna ia membawa tahap risiko yang tinggi dan terdapat kemungkinan anda boleh kehilangan seluruh pelaburan anda. Produk-produk ini tidak sesuai untuk semua pelabur. Pastikan anda memahami sepenuhnya risiko dan pertimbangkan dengan teliti keadaan kewangan dan pengalaman dagangan anda sebelum berdagang. Cari nasihat kewangan bebas jika perlu sebelum membuka akaun dengan BCR.
BCR Co Pty Ltd (No. Syarikat 1975046) ialah syarikat yang diperbadankan di bawah undang-undang British Virgin Islands, dengan pejabat berdaftar di Trident Chambers, Wickham’s Cay 1, Road Town, Tortola, British Virgin Islands, dan dilesenkan serta dikawal selia oleh Suruhanjaya Perkhidmatan Kewangan British Virgin Islands di bawah Lesen No. SIBA/L/19/1122.
Open Bridge Limited (No. Syarikat 16701394) ialah syarikat yang diperbadankan di bawah Akta Syarikat 2006 dan berdaftar di England dan Wales, dengan alamat berdaftar di Kemp House, 160 City Road, London, City Road, London, England, EC1V 2NX. Entiti ini bertindak semata-mata sebagai pemproses pembayaran dan tidak menyediakan sebarang perkhidmatan perdagangan atau pelaburan.

 English
 简体中文
简体中文
 繁體中文
繁體中文
 Bahasa
Melayu
Bahasa
Melayu
 Tiếng
Việt
Tiếng
Việt
 ไทย
ไทย
 日本語
日本語
 한국어
한국어
 ភាសាខ្មែរ
 español