


0
US Dollar Index
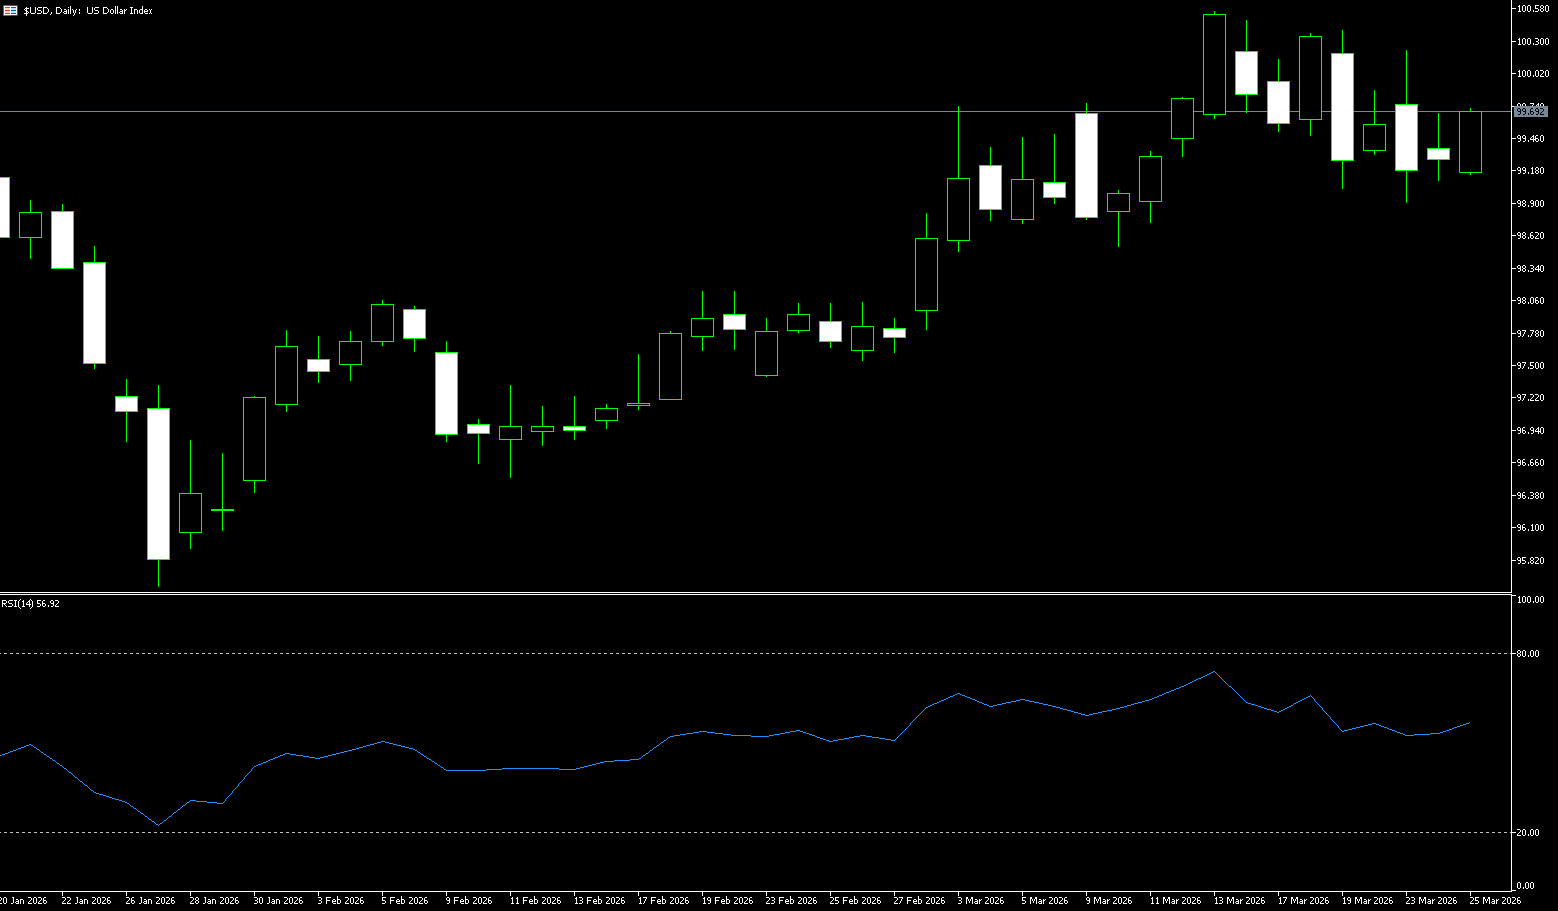
The US dollar index remained around 99.50 on Wednesday, pressured by news of talks between the US and Iran to end the conflict. President Donald Trump stated that Iran had shown goodwill in negotiations related to energy flows through the Strait of Hormuz. Israeli media also noted that Washington is seeking a one-month ceasefire to facilitate negotiations, while The New York Times reported that the US had presented Iran with a 15-point proposal to resolve the conflict. However, investors remained skeptical as Tehran denied any negotiations with the US, while Gulf states indicated their readiness to join a war against Iran. These developments led to a slight decline in oil prices, providing some relief to markets worried that soaring energy costs could drive inflation and prompt interest rate hikes. Meanwhile, Federal Reserve Governor Michael Barr stated that central banks may need to maintain high interest rates for some time to combat inflation.
The US dollar index is currently trading around 99.00. The short-term bias is neutral with a slight bearish tendency. The index failed to hold above the 9-day simple moving average (SMA) around 99.60, and the declining highs on the intraday chart indicate weakening upward momentum. The 14-day RSI is near 50, suggesting that the current phase is more about short covering than new buying. Initial resistance is at the 9-day SMA of 99.65, where recent gains have stalled. If buyers regain control, the area around 100 will present stronger resistance. The psychological level around 99.00 and the intraday support level of 98.88 (this week's low) provide immediate support. A significant break below this area would target the 200-day SMA around 98.38.
Today, consider shorting the US Dollar Index at 99.70, with a stop-loss at 99.80 and targets at 99.30 and 99.20.
WTI Crude Oil
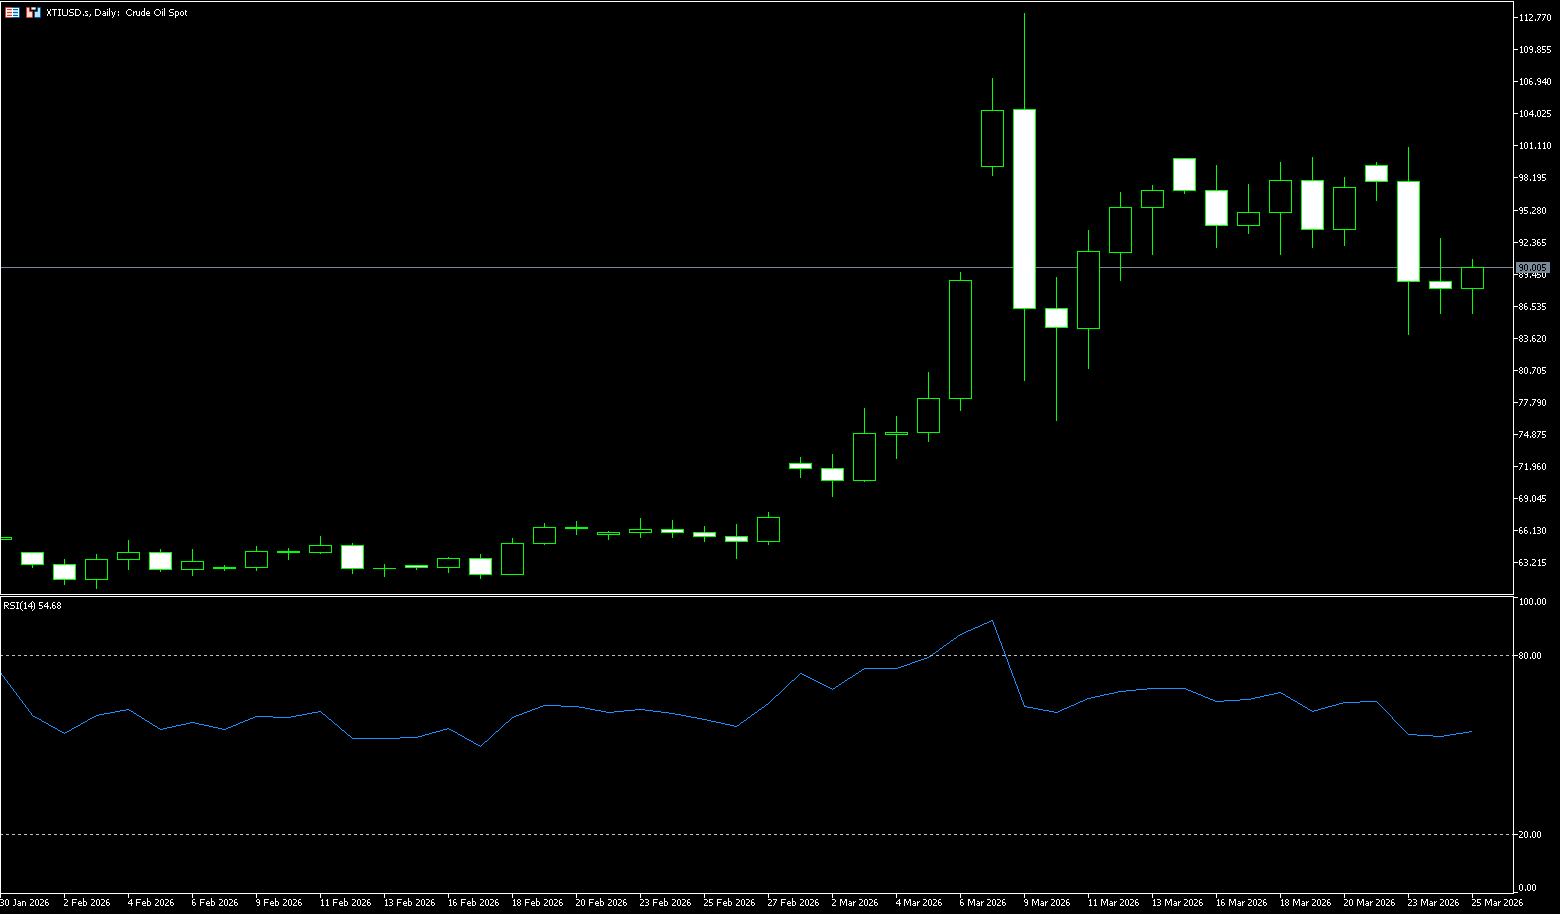
After a false breakout above the psychological level of $100, WTI crude oil prices plummeted to the $86 range. The core driver of this rapid decline was the comments made by the US President. Trump stated that the US had postponed its planned strikes against Iranian energy infrastructure by five days and that productive negotiations were underway. However, Iran subsequently denied this claim, stating that no negotiations had taken place to end the conflict. Furthermore, Israel continued its attacks on Iran, while Tehran launched a new round of attacks on US assets in the Middle East. Against this backdrop, the US President's comments appeared to be a verbal intervention aimed at lowering oil prices—a strategy that has proven effective, as seen in the WTI crude oil price chart. Today, WTI crude oil prices have broken below last week's low.
WTI crude oil prices face strong selling pressure near the psychological level of $100; a support area has formed after the breakout of the local descending channel. This support area significantly mitigated yesterday's oil price decline. Meanwhile, recent price action has formed a wide upward channel, with its lower boundary acting as key support. The $90.00 level (a psychological barrier) that acted as support last week has now become resistance; if bulls attempt a rebound from the lower channel boundary, $95 will be a crucial test of its strength—this is the price level where bears previously pushed prices below the middle channel line. In the short term, caution is advised regarding a pullback driven by risk aversion. A break below the $84.50 (20-day moving average) and the $84.00 (psychological barrier) support zone would further target the $80.00 (psychological barrier) level. In the short term, oil prices are likely to consolidate between the lower channel boundary and $90.00, requiring stronger news catalysts, especially developments in the Strait of Hormuz situation, to potentially break this pattern.
Today, consider going long on spot crude oil at 89.80, with a stop loss at 89.60 and targets at 92.00 and 93.00.
Spot Gold
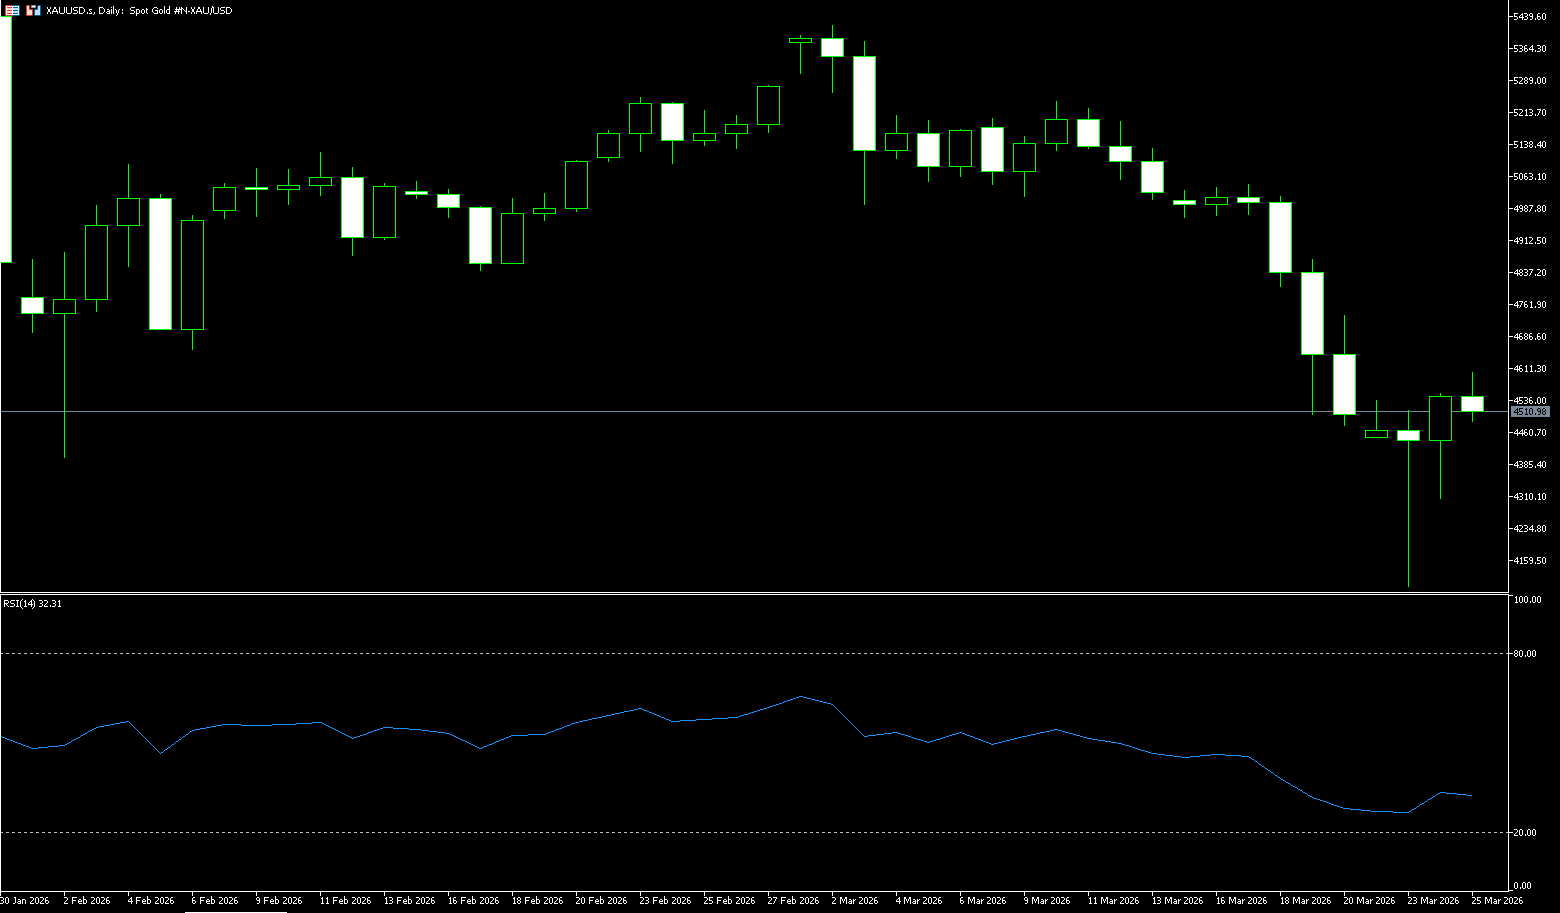
On March 25th, Beijing time, spot gold once again climbed above $4,500 per ounce, as mediators from Turkey, Egypt, and Pakistan pushed for a meeting between US and Iranian officials within the next 48 hours. The dramatic fluctuations in the gold market this week are firmly rooted in the rapidly changing situation in the Middle East. The conflict between the US and Iran has entered its fourth week, reshaping the regional landscape and sending shockwaves through financial markets. The gold market is undergoing a dramatic test. After a sharp pullback of over 20% from its year-to-date high, gold prices rebounded on Wednesday, climbing back above the psychological level of $4,500. This is not simply a trend reversal, but rather a microcosm of the intense struggle between bulls and bears in an extremely complex geopolitical and macro-financial environment. On one hand, there's the quiet diplomatic probing between the US and Iran, under the cover of gunfire; on the other hand, the sharp fluctuations in the energy market are causing a reset of inflation and interest rate expectations. Gold is standing at a critical crossroads.
The current gold market is in an extremely delicate and fragile position. In the short term, its trend is almost entirely determined by the next development of the US-Iran situation. A possible prediction of future gold price movements offers a clear logical line: gold will face pressure in the second quarter, but by the end of the year, as inflation is brought under control, central banks gain greater policy freedom, the dollar may weaken, and interest rates may be lowered, at which point the outlook for gold will become optimistic again. The daily chart shows that gold prices are in the important support zone of $4,500-$4,550, directly testing the 200-day moving average (approximately $4,107) and $4,098 (this week's low). Yesterday's low showed a significant lower shadow, indicating that bulls are actively defending the $4,000-$4,100 area. As long as this support level holds, the overall bullish trend (moving averages still trending upwards) remains intact, despite this being the largest pullback since 2024. A break above $4,716 (the 9-day moving average) would confirm a bottom and open up further upside potential towards $5,000.
Consider going long on spot gold today at $4,507, with a stop-loss at $4,500 and targets at $4,560 and $4,550.
AUD/USD
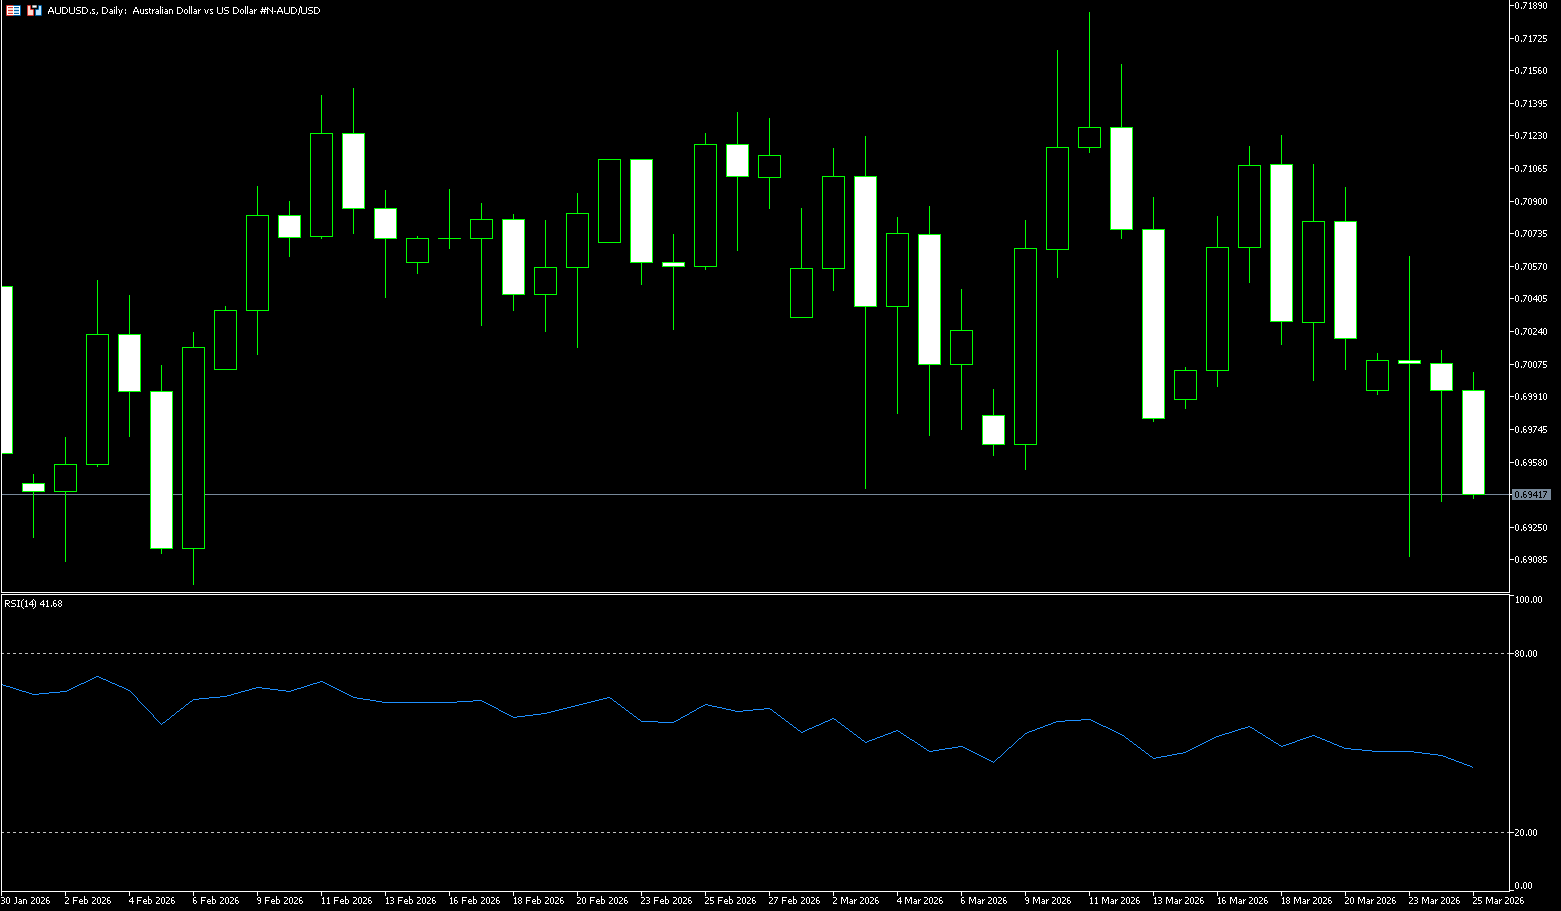
The Australian dollar edged down slightly below 0.7000 against the US dollar on Wednesday, near a two-week low, as caution prevailed over US President Trump's efforts to end the conflict with Iran, while investors weighed weak domestic inflation data. Consumer prices were flat in February, while annual inflation slowed to 3.7% from 3.8%, slightly below expectations. Core inflation also came in below forecasts, suggesting a gradual easing of core pressures. However, inflation remains above the central bank's 2-3% target range, leaving the policy outlook uncertain. The market views the likelihood of another rate hike in May as flat, while pricing in approximately 65 basis points of additional tightening for the remainder of 2026. Meanwhile, reports indicate the US is negotiating with Iran, including a proposed one-month ceasefire and a 15-point plan to resolve the conflict. However, the deployment of US ground troops to the region suggests the risk of escalation remains.
In the short term, the outlook for the Australian dollar remains positive, while also providing a buffer against occasional pullbacks. The Australian dollar further extended its corrective move this week, dragging the AUD/USD pair down to the 0.6950 area on Tuesday, where some initial struggle occurred. The weak spot performance is a reaction to the significant strengthening of the US dollar. AUD/USD is trading at 0.6970. The short-term bias is slightly bearish, as the price is below the declining 20-day simple moving average (around 0.7058), limiting the exchange rate, and repeatedly failed to hold above 0.7000 during the session. The latest Stochastic Relative Strength Index (Stochastic RSI) has rebounded from oversold territory and crossed the middle range, indicating a slight easing of downward momentum. However, a clear bullish reversal has not yet emerged, suggesting that the rebound may face selling pressure as the price remains below long-term moving averages. Immediate support lies at 0.6950 (lower Bollinger Band), formed by a cluster of recent lows. A break below this level would target 0.6900 (psychological level).
Consider going long on the Australian dollar today at 0.6930, with a stop-loss at 0.6920 and targets at 0.6980 and 0.6990.
GBP/USD
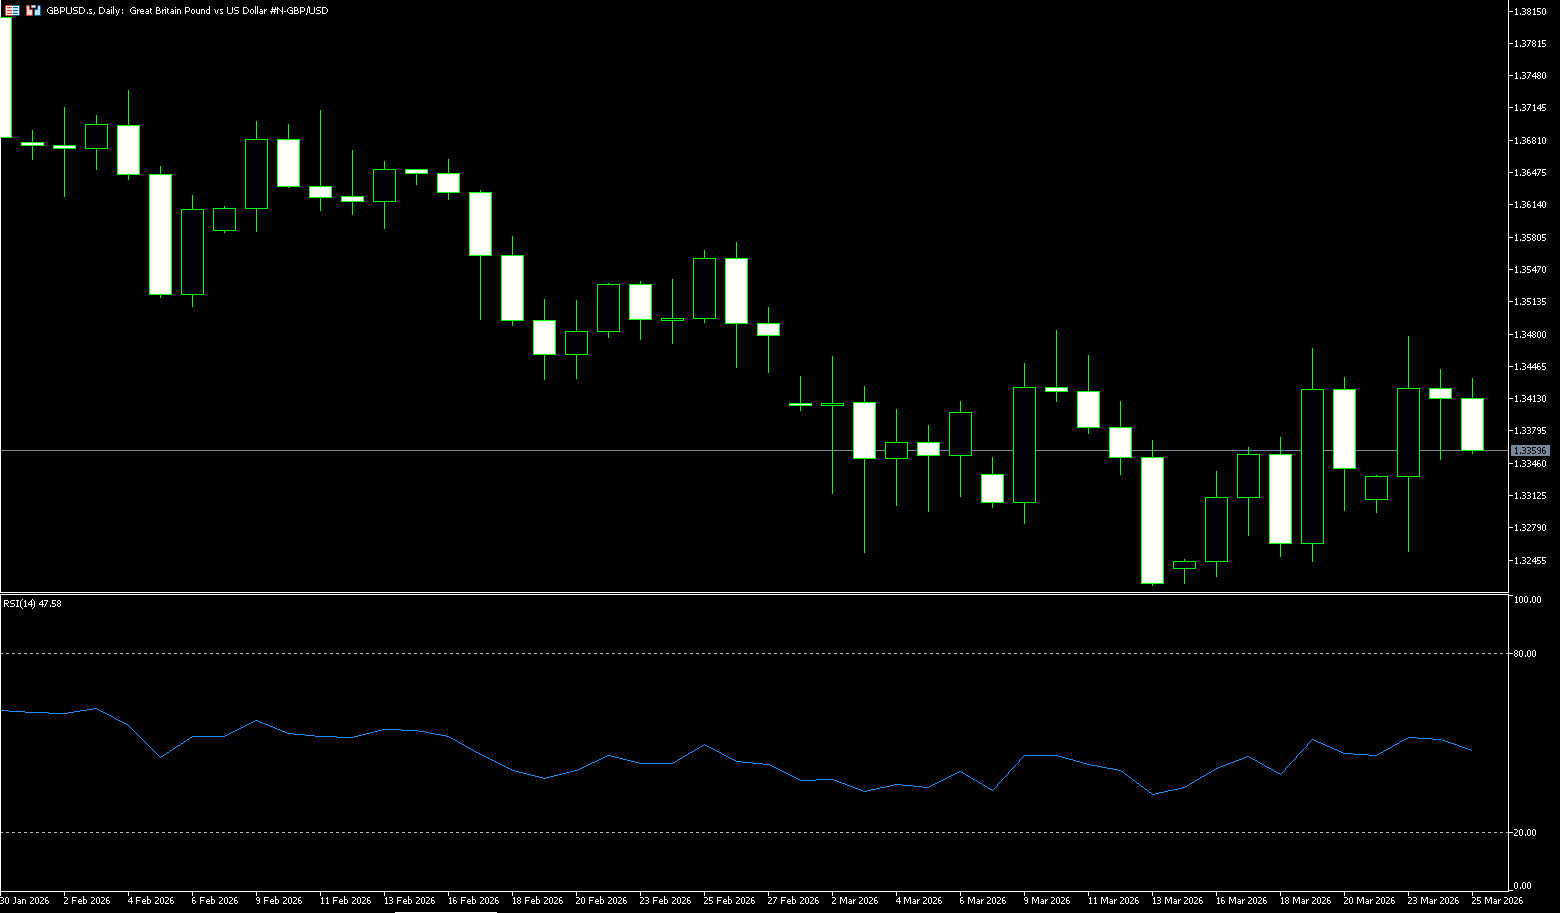
The pound traded near $1.34 on Wednesday as investors reacted to weaker-than-expected PMI data and escalating tensions in the Middle East, increasing concerns about an energy shock. UK business activity growth slowed to its lowest level since September 2025, with the war in Iran dragging down growth and significantly pushing up inflation. Manufacturing cost growth accelerated at its fastest pace since "Black Wednesday" in 1992. Meanwhile, markets remain focused on developments in the war. US President Trump announced a five-day delay to planned strikes on Iranian energy infrastructure, claiming "positive negotiations" were underway, although Tehran denied this, reports suggest indirect talks are ongoing. The recent surge in energy prices has led investors to increase bets on policy tightening this year, with markets now expecting multiple rate hikes from the Bank of England, a stark contrast to the two rate cuts anticipated before the conflict.
The pound/dollar pair rebounded from near a three-month low, testing the key 200-day simple moving average supply zone at 1.3433. The pound/dollar pair spent most of the week consolidating on the downside, hovering near the near three-month low of 1.3218 reached a week ago. However, pound buyers attempted a modest rebound and re-entered the market in the latter half of the week. On the daily chart, the short-term bias for the pound/dollar is slightly bearish, as the spot price continues to hold below the 200-day simple moving average of 1.3433, keeping the pair's movement in the lower half of its trading range. The Relative Strength Index (RSI) is around 48, reinforcing the loss of bullish momentum rather than obvious selling pressure, indicating that sellers still have the upper hand, but the decline is showing a restrained rather than impulsive movement. Near-term support is at 1.3350 (9-day simple moving average), a break below which would expose 1.3300 (psychological level). Initial resistance is at the 200-day simple moving average at 1.3433, paving the way for a further challenge of 1.3480 (Monday's high).
Consider going long on GBP at 1.3355 today, with a stop loss at 1.3343 and targets at 1.3380 and 1.3400.
USD/JPY
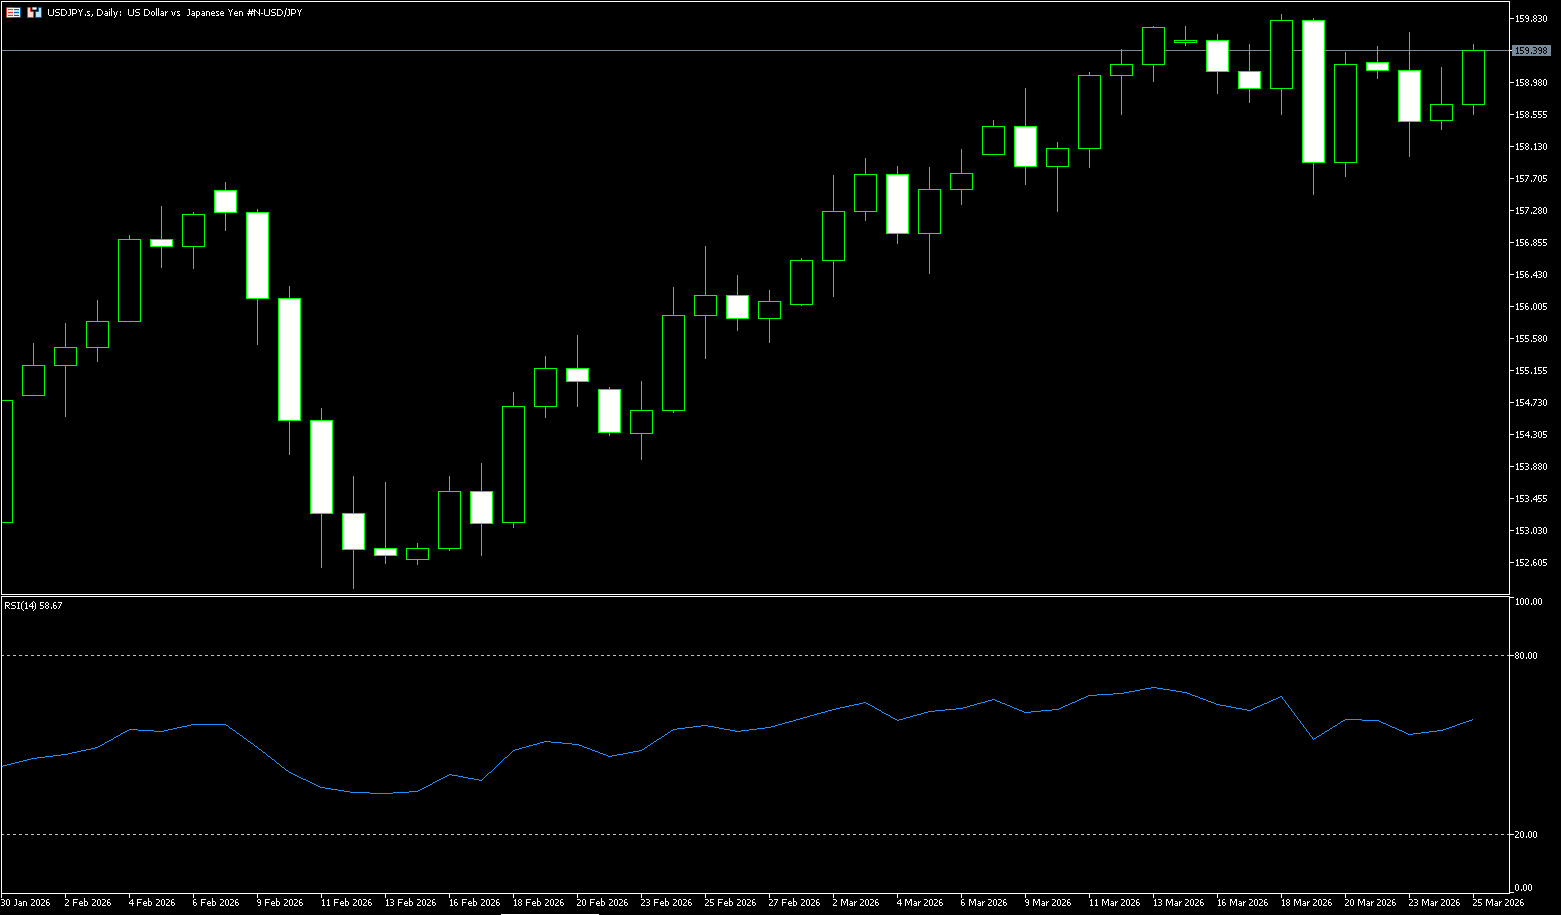
USD/JPY rebounded slightly after recording gains the previous day, trading around 159.20 on Wednesday. The yen received support following the release of the Bank of Japan's January meeting minutes, leading to weakness in the pair. A Bank of Japan member noted that while rising interest rates could put pressure on consumption, the impact on the broader financial system is likely to remain manageable. Policymakers agreed that further rate hikes would be appropriate if economic and inflation forecasts materialize, given that real interest rates remain deeply negative. Most members also emphasized a flexible approach, preferring to make decisions at each meeting rather than committing to a fixed pace of tightening. Meanwhile, USD/JPY traded sideways below 159.00. Despite a slowdown in overall and core inflation in February, underlying price pressures remain higher than the Bank of Japan's fiscal year 2026 forecast. Strong results from the spring wage negotiations were seen as supporting a renewed tightening of policy, reinforcing market expectations of a possible rate hike at the Bank of Japan's April 28 meeting.
USD/JPY resumed its upward trend mid-week, after testing the 20-day simple moving average at 158.22 on Monday and rising to 159.20. While Monday's reversal opened the door to testing lower prices, such as the March 5 pivot low of 156.45, USD/JPY remains bullish. A day ago, bullish momentum weakened, with the 14-day Relative Strength Index (RSI) climbing towards the neutral 60 level. If USD/JPY closes above 159.00, it is expected to test 159.50, followed by 160.00 (a psychological level). However, market concerns about potential intervention by Japanese authorities may keep the pair consolidating. On the downside, the first support level for USD/JPY is the 20-day simple moving average at 158.22. A break below this level would expose 157.50, followed by 157.00 and the 30-day simple moving average area around 156.95. Once these two levels are breached, the next support level is the 100-day simple moving average at 156.31.
Today, consider shorting the US dollar at 159.62, with a stop loss at 159.85 and targets at 158.60 and 158.80.
EUR/USD
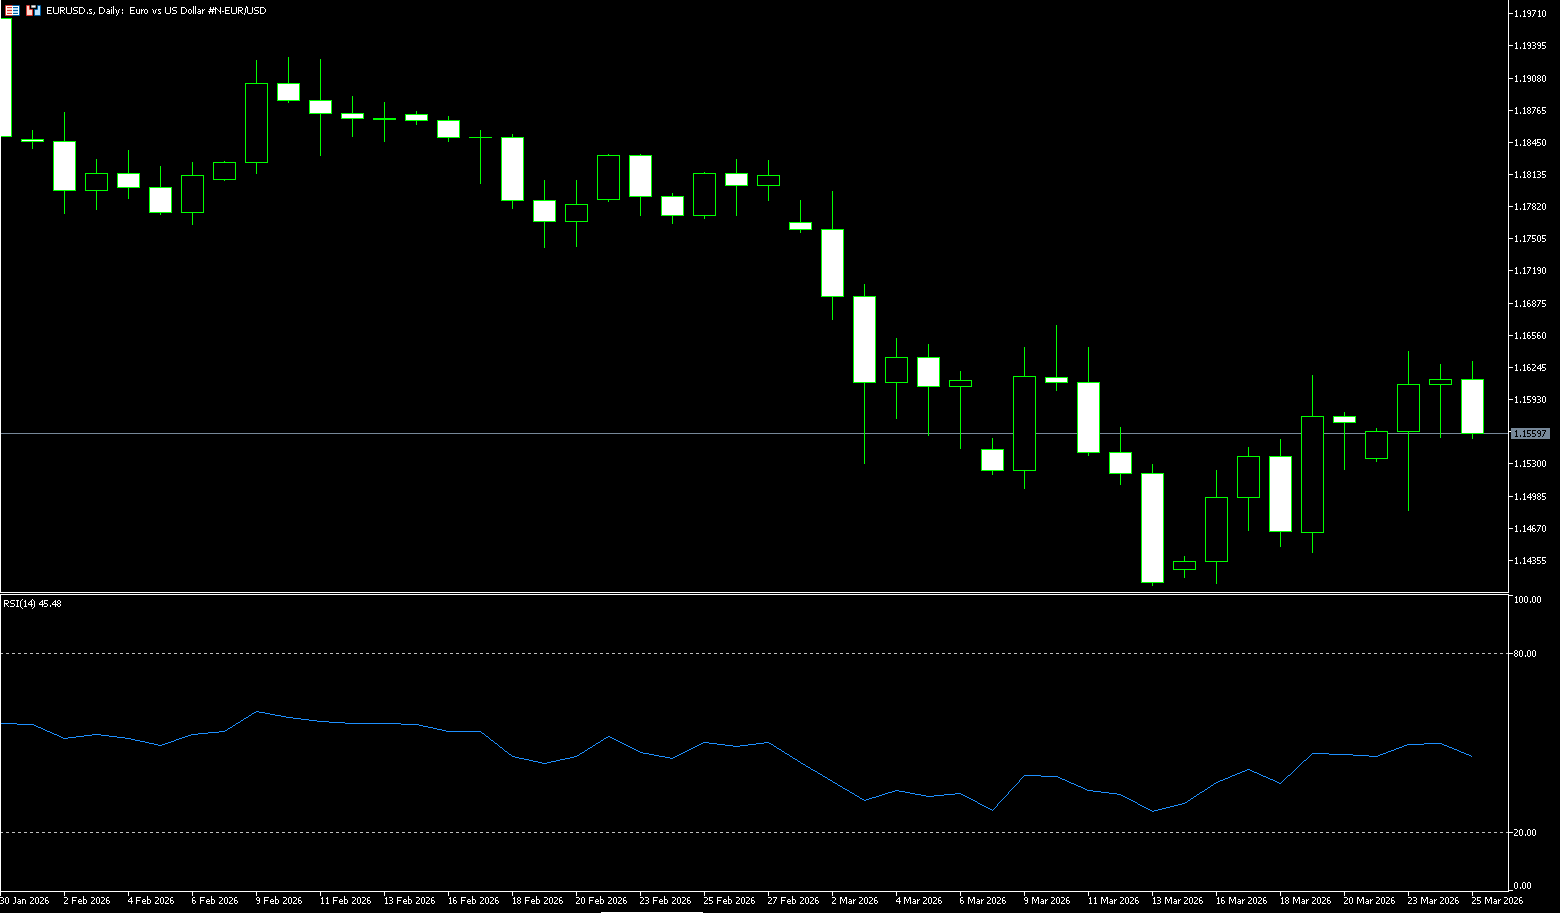
The euro traded near 1.16 on Wednesday as investors weighed weaker-than-expected PMI data and ongoing Middle East tensions, increasing concerns about an energy-driven economic shock. Recent surveys showed eurozone business activity growth fell to its lowest point in ten months in March, as soaring energy prices and war-related supply chain disruptions drove costs up at their fastest pace in over three years. Business confidence collapsed, experiencing its worst decline since Russia's invasion of Ukraine in 2022. US President Trump postponed a strike on Iran by five days, citing "positive negotiations," a claim dismissed by Tehran as "psychological warfare," despite reports that indirect negotiations may be underway. Market expectations for a European Central Bank rate hike have doubled as energy prices surged, despite the central bank's recent decision to keep rates unchanged while raising inflation forecasts and lowering growth expectations amid heightened regional risks.
The US dollar continues to dominate market direction. Currently, upside potential is limited until the Federal Reserve provides clearer guidance or a more convincing recovery emerges in the Eurozone. On the daily chart, EUR/USD is trading slightly below 1.16. The pair continues to trade below the 50-day and 100-day simple moving averages, limiting broader upside and reinforcing the short-term bearish bias as rallies are capped below this dynamic resistance area. The 14-day Relative Strength Index (RSI) hovers around 46.50, indicating weak rather than collapsing downward momentum, suggesting the existing downtrend still has directional strength. Immediate resistance lies at 1.1693 (the 100-day simple moving average), coinciding with the nearby psychological level of 1.17. A daily close above this level would help alleviate downward pressure and pave the way for a further test of 1.1728 (the 55-day simple moving average). Initial support lies at 1.1543 (9-day simple moving average), followed by 1.1500 (a psychological level). A break below these levels would restart the downtrend and expose further weakness.
Consider going long on the Euro today at 1.1545, with a stop-loss at 1.1532 and targets at 1.1600 and 1.1610.
Disclaimer: The information contained herein (1) is proprietary to BCR and/or its content providers; (2) may not be copied or distributed; (3) is not warranted to be accurate, complete or timely; and, (4) does not constitute advice or a recommendation by BCR or its content providers in respect of the investment in financial instruments. Neither BCR or its content providers are responsible for any damages or losses arising from any use of this information. Past performance is no guarantee of future results.
More Coverage


Risk Disclosure:Derivatives are traded over-the-counter on margin, which means they carry a high level of risk and there is a possibility you could lose all of your investment. These products are not suitable for all investors. Please ensure you fully understand the risks and carefully consider your financial situation and trading experience before trading. Seek independent financial advice if necessary before opening an account with BCR.
BCR Co Pty Ltd (Company No. 1975046) is a company incorporated under the laws of the British Virgin Islands, with its registered office at Trident Chambers, Wickham’s Cay 1, Road Town, Tortola, British Virgin Islands, and is licensed and regulated by the British Virgin Islands Financial Services Commission under License No. SIBA/L/19/1122.
Open Bridge Limited (Company No. 16701394) is a company incorporated under the Companies Act 2006 and registered in England and Wales, with its registered address at Kemp House, 160 City Road, London, City Road, London, England, EC1V 2NX. This entity acts solely as a payment processor and does not provide any trading or investment services.

 English
 简体中文
简体中文
 繁體中文
繁體中文
 Bahasa
Melayu
Bahasa
Melayu
 Tiếng
Việt
Tiếng
Việt
 ไทย
ไทย
 日本語
日本語
 한국어
한국어
 ភាសាខ្មែរ
 español

