


0
US Dollar Index
The US dollar index continued its weak trend this week, exhibiting a volatile downward pattern. It initially traded around 98.30. Last week, ahead of the Fed's interest rate decision, market sentiment was cautious, putting pressure on the dollar. After the Fed cut rates as expected, the market interpreted Chairman Powell's statements and policy announcement as less hawkish than anticipated, intensifying the selling pressure on the dollar, and the index fell to a two-month low on Thursday. Year-to-date, the dollar index has fallen by more than 9%, potentially marking its largest annual decline since 2017. The recent weakness of the dollar is partly due to expectations of a Fed rate cut. This Fed action was a "neutral rate cut," but not the "hawkish rate cut" described by some market participants. The Fed's stance differs from some other central banks discussing rate hikes (such as the European Central Bank and the Reserve Bank of Australia).
The dollar index has fallen by about 7% from its January peak. The sharp fluctuations and trend of dollar depreciation in 2025, coupled with a surge in trading volume of hedging tools such as futures and options, may lead to short-term overshooting of the dollar index. In the short term, the US dollar index may fall into a vicious cycle: depreciation expectations → hedging demand → selling dollars → further dollar depreciation → increased hedging demand → selling more dollars → further dollar depreciation. While this spiral cycle may exist in the short term, it is unlikely to be sustainable in the long term and requires comprehensive judgment based on policy intervention and market structure. For most investors, the core signal is clear: the era of dollar exceptionalism is gradually coming to an end. In this new market landscape, the ability to flexibly adjust strategies will directly determine the ultimate success or failure of investment transactions. Therefore, on the downside, the psychological level of 98.00 and the area around 97.46 (the low of October 1st) are key support levels. On the upside, watch the 38.2% Fibonacci retracement level of the rise from 96.22 to 100.39 and the psychological level of 99.00.
Today, consider shorting the US Dollar Index around 98.42; Stop loss: 98.55; Target: 97.90; 98.00

WTI Crude Oil
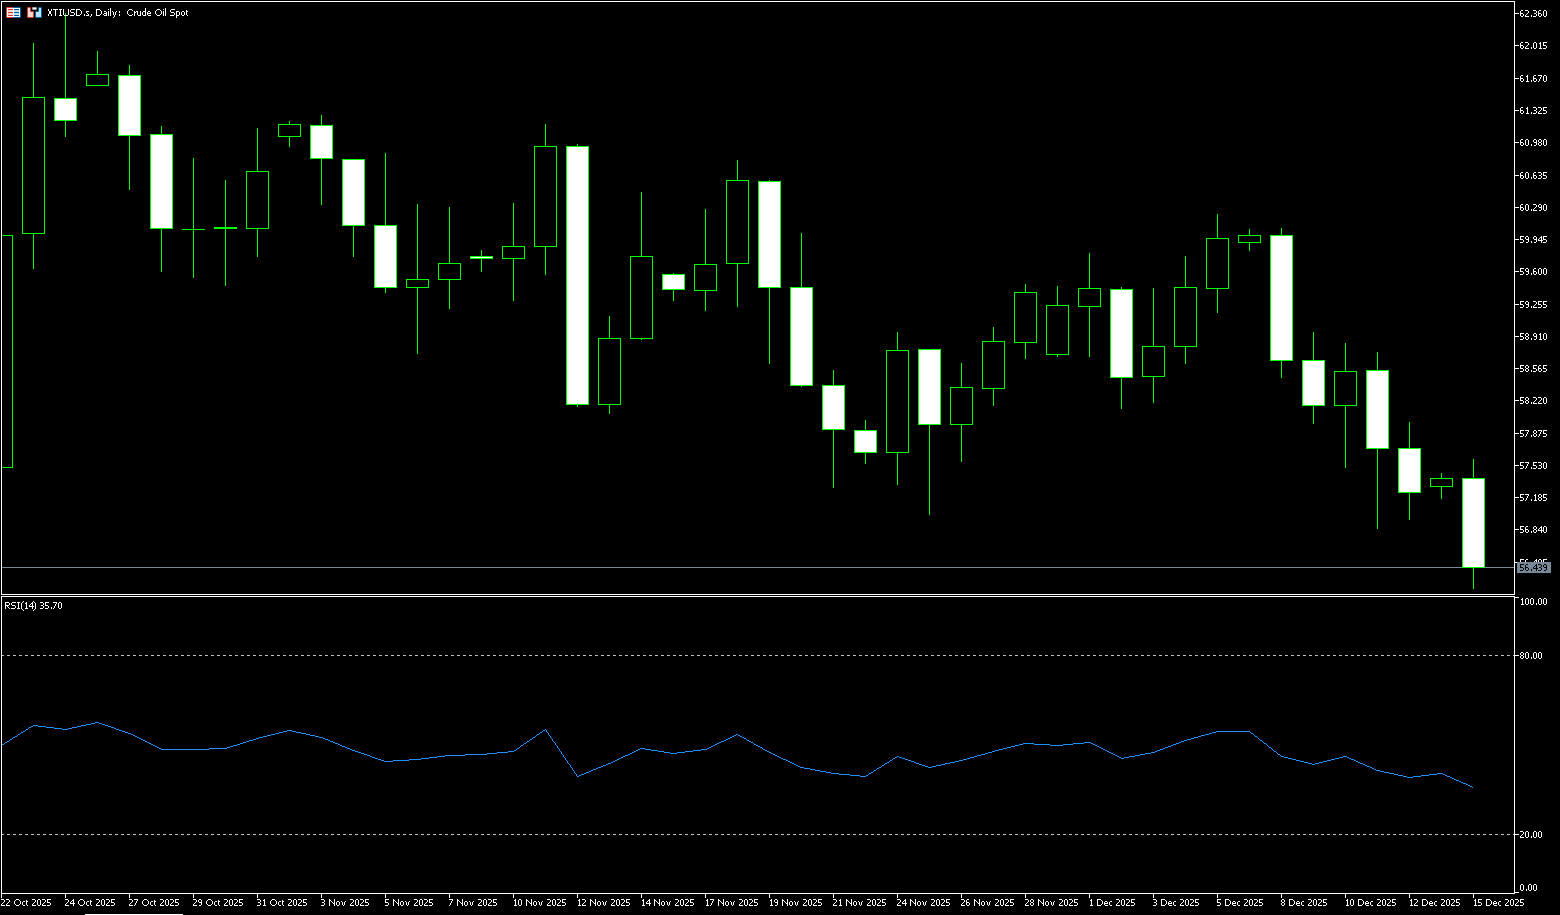
WTI crude oil fell to around $56.60 per barrel on Monday, its lowest level since early 2021, as persistent oversupply pressures outweighed geopolitical risks. Global supply remains ample, with inventories continuing to rise in the US, Brazil, and Guyana, and production growth is expected to continue to outpace demand until 2026, keeping the physical market well-supplied. On the demand side, weak signals from China, including sluggish industrial activity and increasing reliance on renewable energy generation, have exacerbated concerns that demand growth will be insufficient to absorb excess crude oil. Progress in the Ukraine peace talks has also put pressure on prices, as any credible ceasefire path would erode the risk premium associated with potential Russian supply disruptions. Meanwhile, US actions against Venezuela and tensions involving Iran in the Gulf of Oman provided only limited support, as these risks were seen as insufficient to tighten global supply.
On the daily chart, WTI crude oil prices show a weak trend, not only breaking through key support levels but also with short-term moving averages forming a clear downward alignment, indicating that bearish forces are dominating the market. Recent consecutive days of downward pressure further confirm that the market has entered a new downward trend from its previous high-level consolidation phase. The MACD indicator has fallen back below the zero line, indicating that momentum is tilting towards the bears. The market's acceptance of any rebound is currently low. Oil prices are likely to fall back to the support range of $56.88 (last Thursday's low) - $57.00 (psychological level). If this range is broken, the next key support levels will be $55.97 (October 20th low) and around $55.50. If, with the help of escalating geopolitical conflicts, a breakout above the resistance range of $59.27 (50-day moving average) and $60.00 (psychological level) is achieved, a further test of the $61.41 (100-day moving average) is possible.
Today, consider going long on crude oil around 56.35; Stop loss: 56.18; Target: 57.50; 57.70
Spot Gold
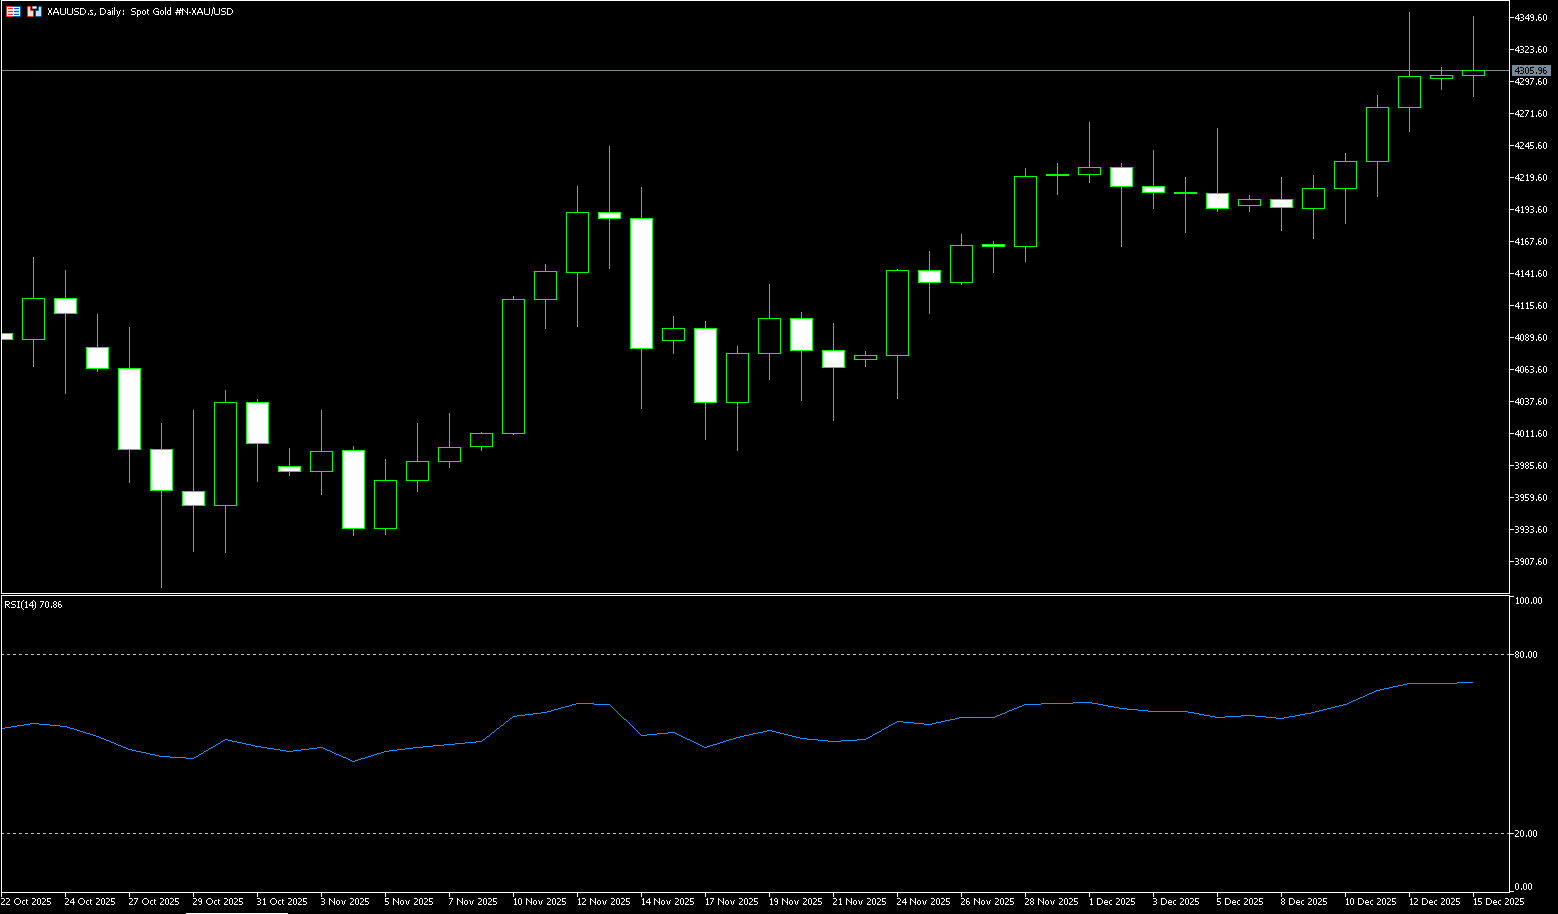
On Monday, spot gold traded around $4,308 per ounce. Shootings occurred in the US and Australia over the weekend, and with the Christmas holidays approaching, coupled with Trump's expectation of a peace agreement in Ukraine before Christmas, geopolitical uncertainty increased, boosting gold prices. Although the Federal Reserve hinted at caution regarding further rate cuts before more data is released, investors still expect two rate cuts next year, providing strong support for gold. As a traditional safe-haven asset, gold continues to attract inflows amidst heightened global uncertainty. Currently, gold is the mainstream trend in the market, with central banks, pension funds, and investment funds continuing to buy. Short-term profit-taking will not change the technical upward trend. In short, after the data vacuum ends, gold trading opportunities will become clearer. It is recommended to closely monitor real-time developments, operate rationally, and avoid chasing highs.
The daily chart shows that gold prices are trending upwards. Although gold is currently hovering around $4,300, bulls still dominate, even though the 14-day Relative Strength Index (RSI) is in overbought territory at 71.65. The RSI still shows a bullish trend, suggesting strong buying pressure. If gold prices break through last week's high of $4,353.60, it will open the door to testing the all-time high of $4,381. Once this level is broken, the next targets will be $4,400 and $4,500. Conversely, if gold prices fall below the $4,300 level and the December 11 high of $4,285, it is expected to fall further to $4,268 (the 5-day simple moving average), followed by the $4,200 psychological level.
Consider going long on spot gold around 4,303 today; Stop loss: 4,298; Target: 4,330; 4,340
AUD/USD
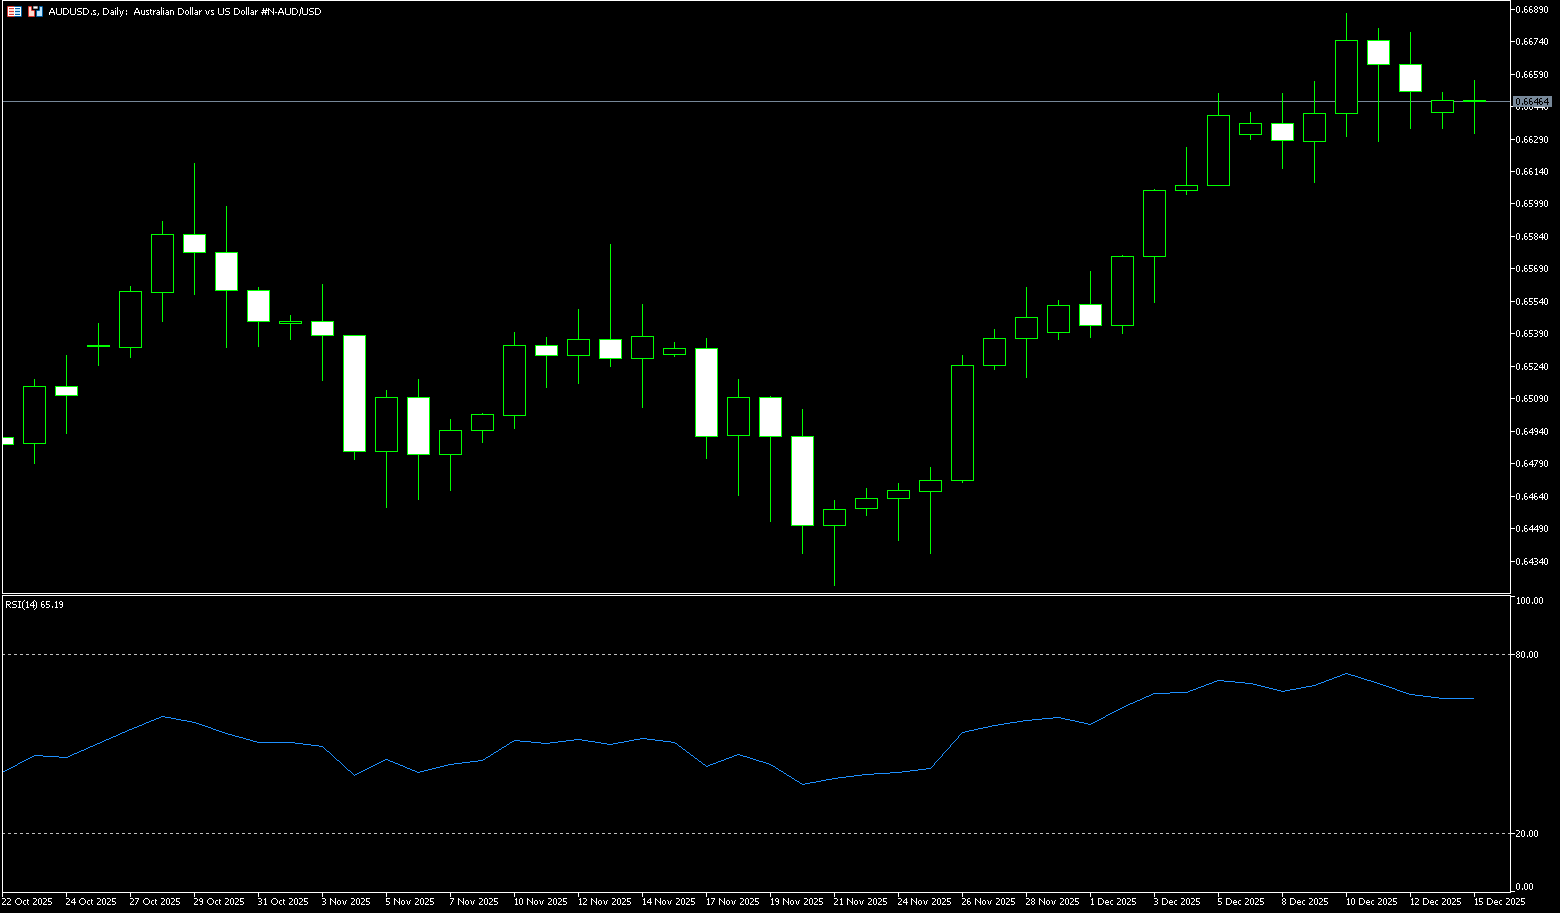
The AUD/USD pair fell to near 0.6640 during Monday's trading session. The Australian dollar pair came under pressure after China's National Bureau of Statistics reported unexpectedly weak November retail sales and industrial production data. The Australian dollar has been consolidating over the past two trading days following the release of weak November labor market data. Thursday's data showed the economy lost 21.3K jobs in November, compared to an expected increase of 20K new workers, raising concerns about the strength of the labor market. Meanwhile, the overall outlook for the Australian dollar pair remains solid as the US dollar struggles to regain its position amid hopes that the Federal Reserve will cut interest rates further in 2026, an expectation higher than predicted at last week's policy meeting. The main trigger for the US dollar this week will be the US November non-farm payroll data, to be released on Tuesday.
The Australian dollar/US dollar pair traded steadily around 0.6640 in early trading this week. The pair is holding above its rising 20-day simple moving average, currently at 0.6564, supporting a bullish bias. The 20-day simple moving average has been rising for several consecutive trading days and continues to lead the trend upwards. The 14-day Relative Strength Index (RSI) on the daily chart is at 64.35 (bullish, near overbought), confirming strong momentum, while also approaching a zone where profit-taking could slow. With increasing momentum, the bulls remain in control, although near overbought territory could limit further gains and lead to consolidation. A pullback is expected to find support near the rising moving average. A close below 0.6600 (a psychological level) would open the way for a broader correction targeting the 20-day simple moving average at 0.6564 and the November 14 high of 0.6551; otherwise, as long as prices move in the direction of the trend, the broader trend will remain upward. On the upside, the rally could extend to the 0.6700 level and the September 17 high of 0.6707.
Consider going long on the Australian dollar today around 0.6630; Stop loss: 0.6620; Target: 0.6680; 0.6685
GBP/USD
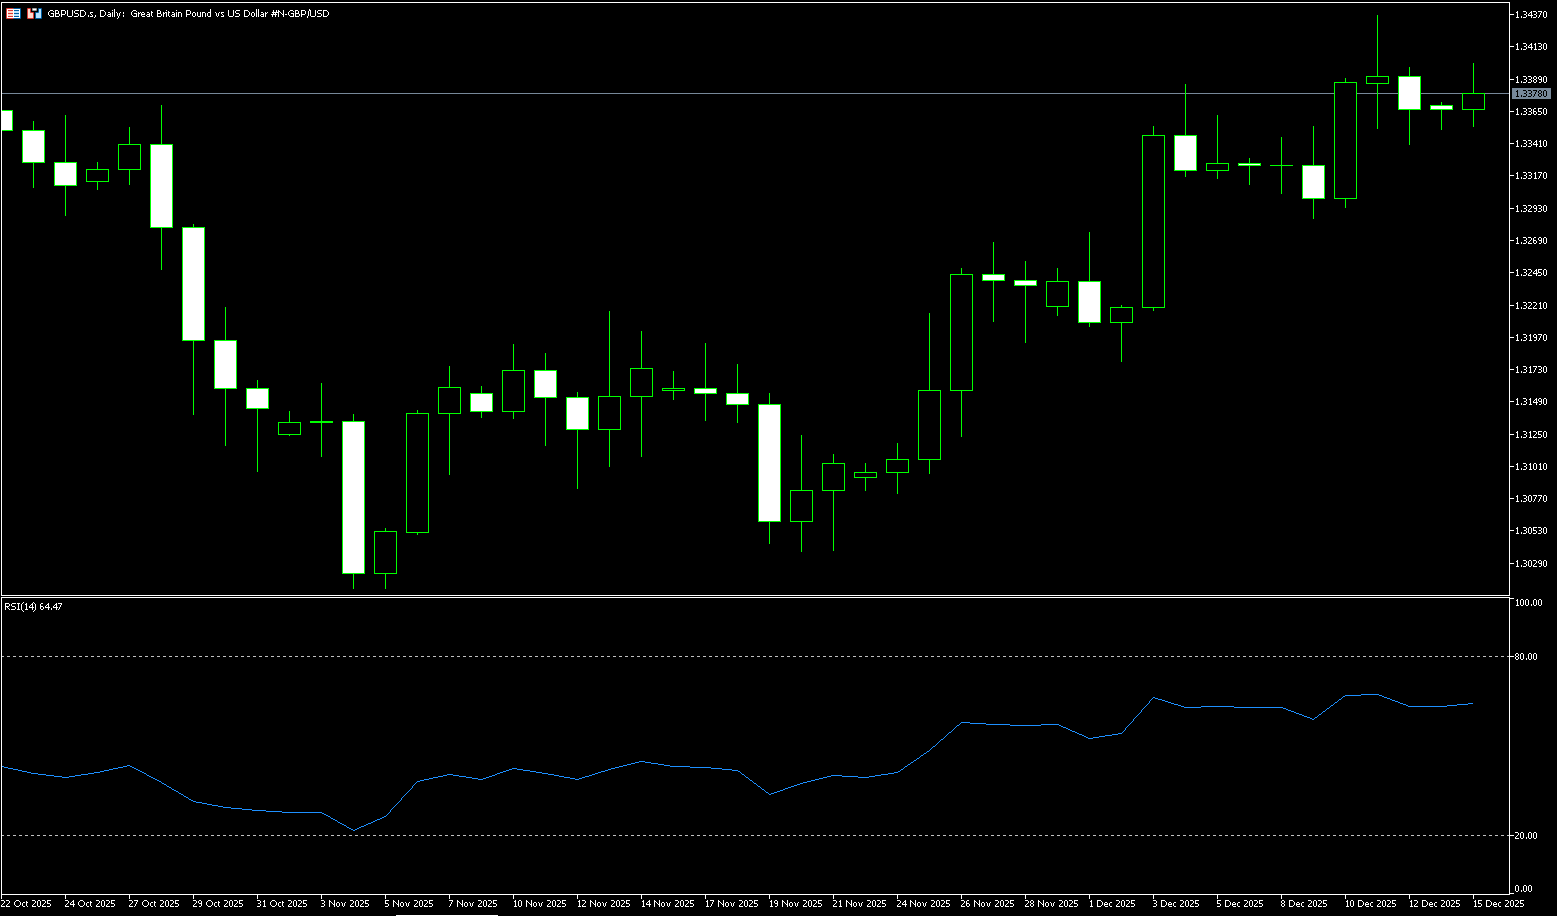
GBP/USD remained defensive during Monday's Asian session, despite a lack of bearish sentiment, holding above key support at the 200-day simple moving average. The spot price is currently trading in the 1.3360 area, with little change on the day. The US dollar is attempting to continue its upward trend from last week's slight rebound from a more than two-month low and is a key factor posing resistance to GBP/USD. A slight deterioration in global risk sentiment—evident in the generally weak tone of equities—is thought to provide some support for the safe-haven dollar. However, dollar bulls seem reluctant to make aggressive bets in the face of dovish Fed expectations. Furthermore, the prospect of a Trump-backed Fed chair should limit any substantial dollar rally. UK monthly employment data will be released on Tuesday, followed by the delayed US October non-farm payrolls report. Next is the crucial Bank of England policy decision on Thursday, which will have a significant impact on the pound.
The break above the 50-day simple moving average (at 1.3272) and the confluence of 1.3283 (the 38.2% Fibonacci retracement level between 1.3726 and 1.3010) earlier this month was considered a key trigger for the GBP/USD bulls. With oscillators on the daily chart remaining in positive territory, some follow-through buying above the 1.3366 area (the 50% Fibonacci retracement level) would push the spot price back to the psychological level of 1.3400. Momentum could extend further to the 61.8% Fibonacci retracement level, around 1.3452, and move towards the psychological level of 1.3500. On the other hand, a corrective pullback is now likely to find considerable support near the psychological level of 1.3300. Any further declines could be viewed as buying opportunities, with limited movement expected around 1.3253 (currently at the 50-day simple moving average). Following that is the 1.3200 level.
Consider going long on GBP around 1.3360 today; Stop loss: 1.3350; Target: 1.3400; 1.3410
USD/JPY
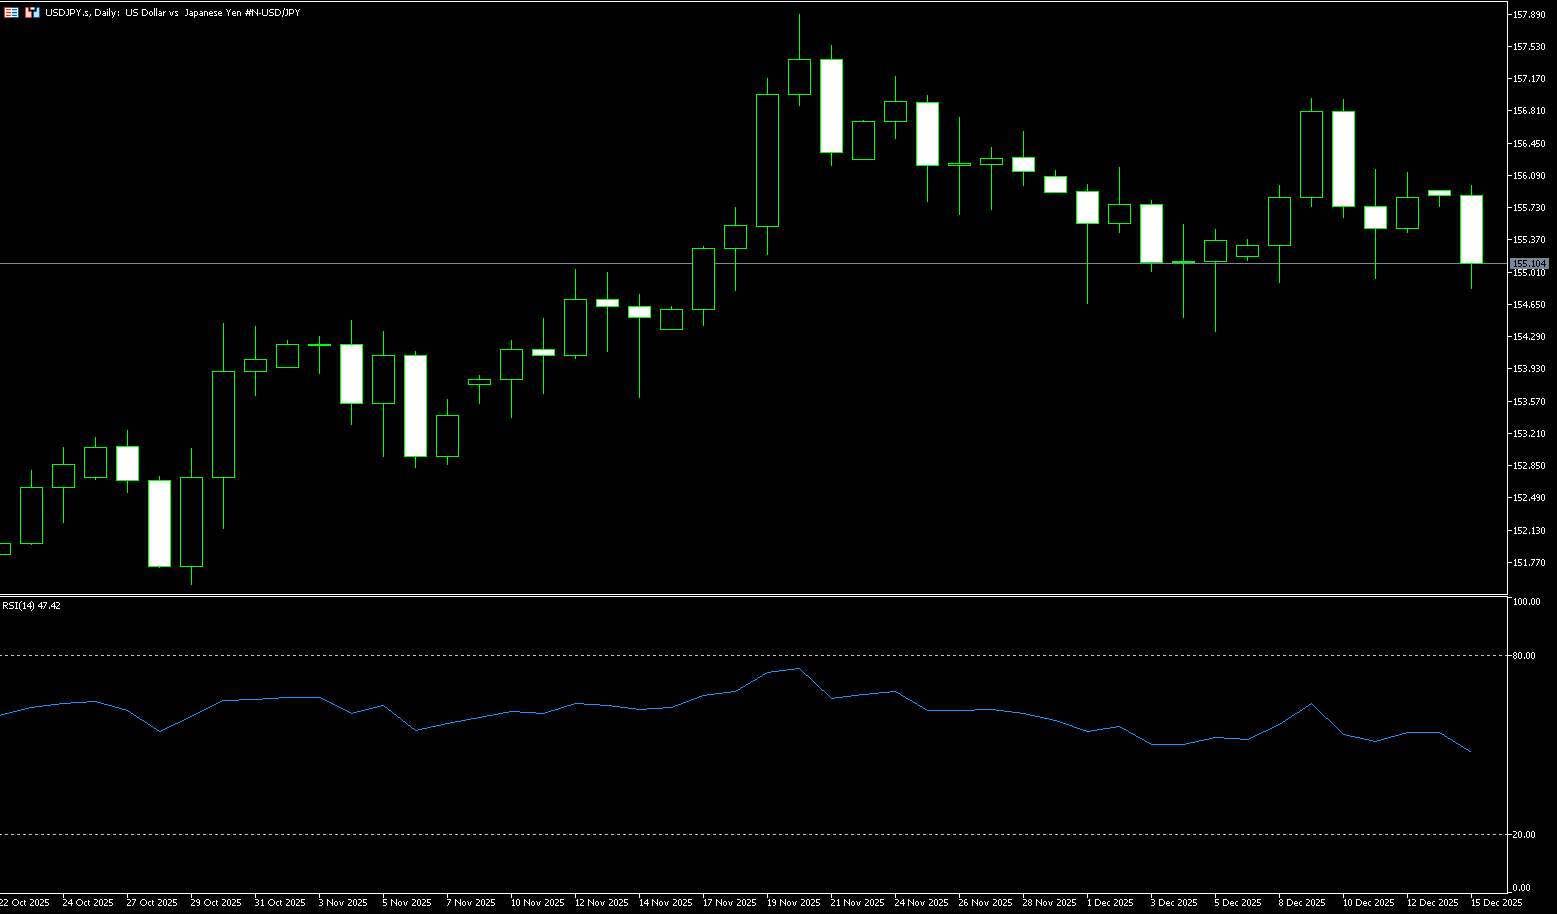
The yen rose to around 155.30 yen per dollar on Monday, reversing losses from the previous session, as investors prepared for this week's Bank of Japan policy meeting. The central bank is widely expected to raise the policy rate by 25 basis points to 0.75%. Market focus will be on Governor Kazuo Ueda's post-meeting remarks for guidance on the policy trajectory next year, with analysts expecting the rate to reach 1% in July. Expectations of tighter policy are supported by strong domestic economic data, including consumer inflation remaining above historical levels. The report also indicated that senior officials stated that members of the Sanae Takaichi cabinet were unlikely to oppose interest rate hikes, citing concerns that a weaker yen due to the Bank of Japan's delayed tightening policy was pushing up import costs and inflation. Furthermore, central bank data showed that the confidence index for large manufacturers rose from +14 in the third quarter to +15 in the fourth quarter, reaching its highest level in four years.
From a technical perspective, the USD/JPY pair struggled to rise above the 20-day simple moving average at 156.06, and subsequent declines favored bearish traders. However, the positive oscillator on the daily chart suggests that any further declines are more likely to find good support near the psychological level of 155.00. A decisive break below this level would risk an accelerated decline towards the monthly low of the 154.35 area, further testing the 154.00 level. On the other hand, the current level at the psychological level of 156.00 and the 156.06 {0-day simple moving average} are likely to continue to act as immediate resistance. If some follow-through buying appears above the aforementioned area, it could trigger a short-term pullback and push USD/JPY up to around 157.00. A sustained strong break above this level would pave the way for further gains, eventually reaching the multi-month high near 158.00 reached in November.
Consider shorting USD around 155.48 today; Stop loss: 155.65; Target: 154.50; 154.30
EUR/USD
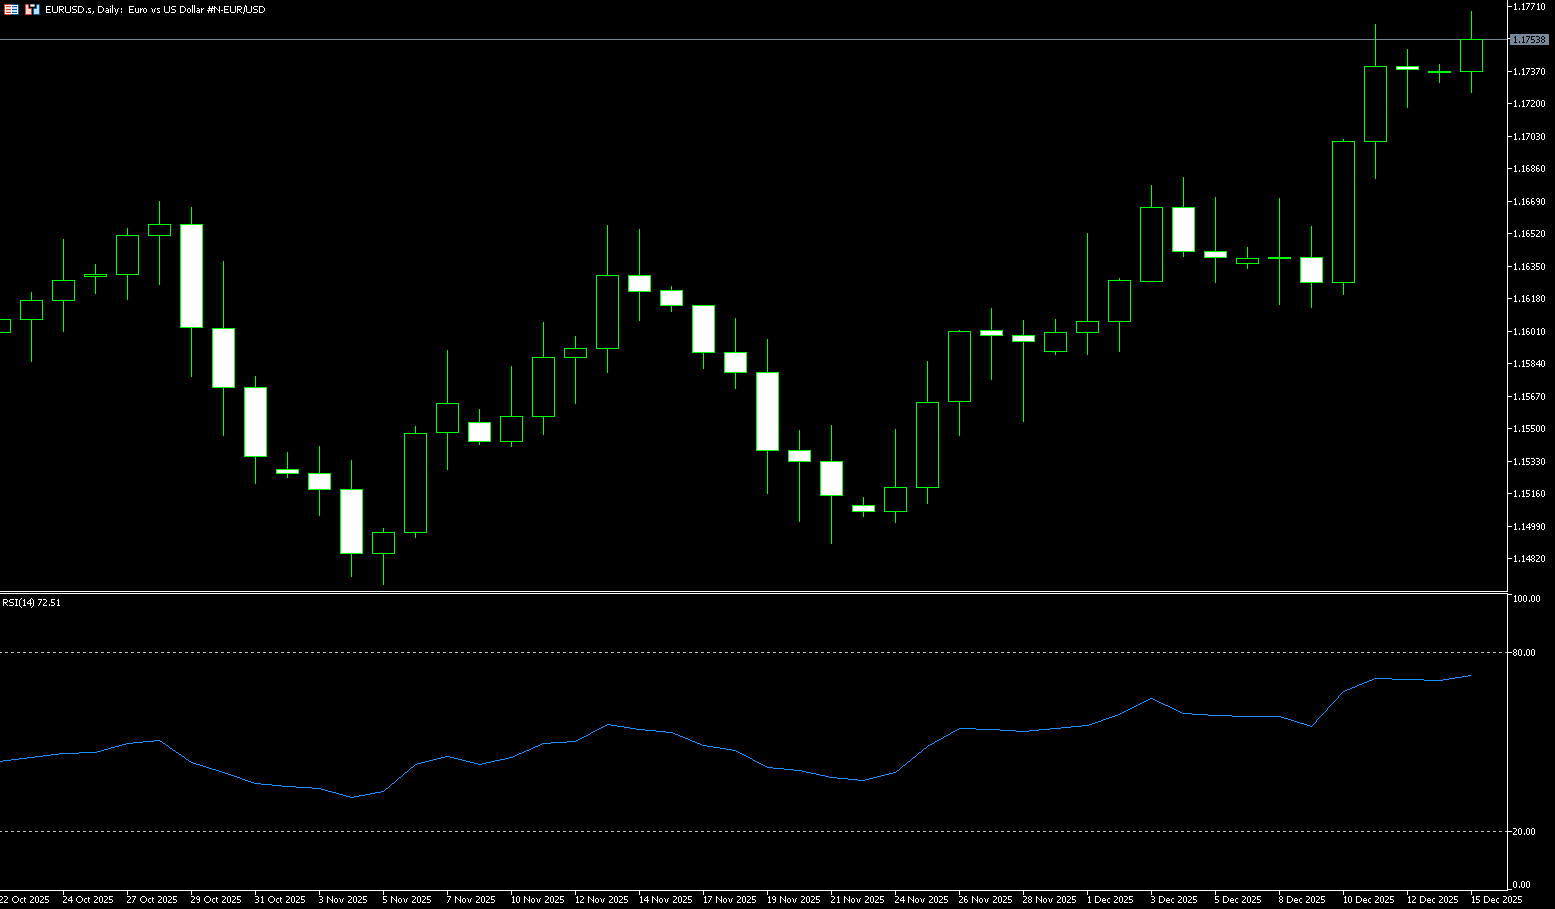
EUR/USD started the new week flat, although it remains near its highest level since early October, last touched last Thursday. The spot price is currently trading around 1.1750. The dollar attempted to rise early in the week, which in turn was seen as resistance for the EUR/USD pair. However, the dollar's rebound lacks a clear fundamental catalyst and is more likely to remain limited under dovish Fed expectations. The Fed signaled caution last week after its third rate cut this year, indicating no further rate cuts. However, traders are still pricing in the possibility of two more rate cuts next year, as signs of a weakening labor market become increasingly apparent. The prospect of a Fed chair aligned with Trump could dampen any attempts at a dollar rally. On the other hand, the ECB's halt to rate cuts should provide renewed momentum for the EUR/USD pair.
Looking at the recent fundamental and technical context, the EUR/USD technical chart suggests a neutral-to-upward bias for the pair, a trend that could be consolidated if it closes above the 1.1700 psychological level this week. The 14-day Relative Strength Index (RSI) indicates that buyers are building momentum, suggesting further upside potential. If EUR/USD breaks above the 1.1800 psychological level, the next resistance is at the September 23 high of 1.1818. Conversely, if the pair falls below 1.1700, the first support level will be the 100-day simple moving average at 1.1644, followed by the psychological level of 1.1600.
Consider going long on the Euro today around 1.1740; Stop loss: 1.1728; Target: 1.1780; 1.1790
Disclaimer: The information contained herein (1) is proprietary to BCR and/or its content providers; (2) may not be copied or distributed; (3) is not warranted to be accurate, complete or timely; and, (4) does not constitute advice or a recommendation by BCR or its content providers in respect of the investment in financial instruments. Neither BCR or its content providers are responsible for any damages or losses arising from any use of this information. Past performance is no guarantee of future results.
More Coverage


Risk Disclosure:Derivatives are traded over-the-counter on margin, which means they carry a high level of risk and there is a possibility you could lose all of your investment. These products are not suitable for all investors. Please ensure you fully understand the risks and carefully consider your financial situation and trading experience before trading. Seek independent financial advice if necessary before opening an account with BCR.
BCR Co Pty Ltd (Company No. 1975046) is a company incorporated under the laws of the British Virgin Islands, with its registered office at Trident Chambers, Wickham’s Cay 1, Road Town, Tortola, British Virgin Islands, and is licensed and regulated by the British Virgin Islands Financial Services Commission under License No. SIBA/L/19/1122.
Open Bridge Limited (Company No. 16701394) is a company incorporated under the Companies Act 2006 and registered in England and Wales, with its registered address at Kemp House, 160 City Road, London, City Road, London, England, EC1V 2NX. This entity acts solely as a payment processor and does not provide any trading or investment services.

 English
 简体中文
简体中文
 繁體中文
繁體中文
 Bahasa
Melayu
Bahasa
Melayu
 Tiếng
Việt
Tiếng
Việt
 ไทย
ไทย
 日本語
日本語
 한국어
한국어
 ភាសាខ្មែរ
 español